

Data and statistics are incredibly helpful for many things in life, and this is especially true for applying to Oxbridge and helping your students with their applications. There are many factors at play within the Oxbridge admissions process, so having a greater understanding of them can only be a benefit!
In this guide, written specifically for teachers, we’ll explore why understanding admissions statistics and data is so important in the Oxbridge application process. We’ll provide you with the latest Oxford and Cambridge admissions statistics, while also showing you how to find, analyse, and use this data yourself. Of course, you won’t remember all of these figures off the top of your head, so we hope this guide inspires you to create your own system for collecting and presenting application data to support your students. Let’s get straight into it.
Why Are Oxbridge Admissions Statistics Important?
Oxbridge admissions are among the most competitive university application processes in the world, so understanding the data behind them can give teachers and students a significant strategic advantage. Admissions statistics help to turn a complex process into something more measurable, allowing you to move beyond assumptions and make decisions based on evidence.
As a teacher, you already use data every day to assess student performance, identify strengths and weaknesses, predict outcomes, and plan teaching strategies. Oxbridge application data works in much the same way. By analysing statistics such as application numbers, offer rates, acceptance rates, subject competitiveness, admissions test performance, and interview success rates, you can build a clearer picture of what students are up against and where opportunities may exist.
This data can help answer important questions, such as:
- How competitive is a specific Oxford or Cambridge course
- How many applicants receive offers each year
- Are success rates changing over time
- Which subjects attract the highest levels of competition
- What trends could affect future applicants
For teachers, these insights can improve student guidance and help shape more informed application strategies. Instead of relying on anecdotal advice, you can use admissions data to support conversations with evidence, manage student expectations, and identify realistic but ambitious choices.
This is especially important at Oxbridge, where small differences in competitiveness can have a major impact on outcomes. In a highly selective admissions process, understanding the numbers behind each course can help students make better-informed decisions and approach their applications more strategically.
Simply put: the more clearly you understand Oxbridge admissions data, the better equipped you are to support students through one of the most competitive university application processes in the world.
So, what data is available, and what can it actually tell us? Let’s explore that next.
Claim Your FREE Oxbridge Applications Resource Pack
Gain access to our 12-Document Oxbridge Resource Pack, including our Oxbridge Application Data poster and many more helpful Oxbridge tools. The pack contains handouts, templates, lesson plans and much more, helping you prepare your students for every step of the application process. Fill out the form below and gain instant access.

Key Oxbridge Application Data
The amount of data available to us relating to Oxbridge admissions is extremely large, so we need to start off with some core figures that are relevant to any applicant. The biggest one of these is the success rates for each university:
Oxbridge Success Rates
The table below shows the average overall offer and acceptance rates based on admissions data from 2020 to 2025. Please note that Oxford’s 2025 admissions statistics have not yet been published, so Oxford’s averages are calculated using five years of data, while Cambridge’s are calculated using six.
Across these years, Oxford’s average offer rate was 15.82%, compared with Cambridge’s 20.85%. Their average acceptance rates were 14.22% and 16.8% respectively. These figures suggest that Oxford has been more competitive over the period, based on consistently lower offer and acceptance rates.
| Overall Oxbridge Offer Rate | Overall Oxbridge Acceptance Rate |
|---|---|
| 18.34% | 15.51% |
2025
Applicants: 23,329
Offers: 3,891
Offer Rate: 16.7%
Acceptance Rate: 14.2%
2024
Applicants: 23,051
Offers: 3,793
Offer Rate: 16.4%
Acceptance Rate: 14.1%
2023
Applicants: 23,211
Offers: 3,721
Offer Rate: 16.0%
Acceptance Rate: 13.9%
2022
Applicants: 23,819
Offers: 3,645
Offer Rate: 15.3%
Acceptance Rate: 13.7%
2021
Applicants: 24,338
Offers: 3,555
Offer Rate: 14.6%
Acceptance Rate: 13.6%
2020
Applicants: 23,414
Offers: 3,932
Offer Rate: 16.8%
Acceptance Rate: 15.8%
2025
Applicants: 22,820
Offers: 4,947
Offer Rate: 21.7%
Acceptance Rate: 16.3%
2024
Applicants: 22,153
Offers: 4,760
Offer Rate: 21.5%
Acceptance Rate: 16.4%
2023
Applicants: 21,445
Offers: 4,553
Offer Rate: 21.2%
Acceptance Rate: 16.6%
2022
Applicants: 22,470
Offers: 4,238
Offer Rate: 18.9%
Acceptance Rate: 15.8%
2021
Applicants: 22,795
Offers: 4,260
Offer Rate: 18.7%
Acceptance Rate: 16.1%
2020
Applicants: 20,426
Offers: 4,710
Offer Rate: 23.1%
Acceptance Rate: 19.6%
This data encompasses all applicants at each university and gives a general idea of not only how likely an individual is to receive an offer, but also how likely they are to securing a place. As you can see, it’s not particularly high, and the trends aren’t positive for applicants right now. You can view the acceptance rates for all courses at Cambridge or Oxford in our definitive guides, including 2024 admissions.
To put it bluntly, applicant numbers are rising while offer numbers are stagnating or declining. That isn’t good for your students, but it’s not something that can be changed. However, knowing this information puts them a step ahead of many of their competitors. Having an understanding of the Oxbridge landscape is essential to preparing their application to suit Oxbridge expectations.
Oxbridge Demographic Data
Although it may feel outdated by today’s standards, the data relating to different demographics of applicants do still display certain trends. Although the differences are often negligible, it will still be important to consider as certain factors could make your students more or less likely to receive an offer, at least on paper. In reality, the Oxbridge application process ensures that discrimination of any kind is not present, so take the data with a pinch of salt.
Oxbridge Gender Ratios
The gender ratios at Oxford and Cambridge are much more equal than they would have been many years ago, so the differences between male and female applicants are usually not large. The following ratios related to accepted applicants who received offers:
Oxford Male:Female Intake
2024: 48:52
2023: 48:52
2022: 47:53
2021: 45:55
2020: 46:54
2019: 46:54
Cambridge Male:Female Intake
2024: 48:52
2023: 49:51
2022: 49:51
2021: 49:51
2020: 48:52
2019: 51:49
As you can see, there is generally a higher amount of successful female applicants each year. In some courses, this statistic can be much more exaggerated (the ratio for Oxford Medicine in 2020 was 41:59), but these figures shouldn’t serve as much of a roadblock for any male students in your cohort.
UniAdmissions' Teacher Tips
- For the first time in 2024, Oxford recorded applications with Gender stated “Other”, meaning individuals who identify outside of binary gender, as well as those who chose not to state their gender. In total, there were 491 applications that didn't identify as Male or Female, approximately 2% of the applicant pool.
Oxbridge Home Applicants
All of these admissions statistics so far have related to the whole cohort, including international applicants, so let’s take a look at the success percentage of applicants and offers made to home applicants within the UK:
UK Oxbridge Applicant Rates
Oxford
2025
Applicants: 14,340
Offers: 3,006
Success Rate: 21%
Percentage of Offers: 77.3%
2024
Applicants: 14,694
Offers: 2,996
Success Rate: 20.4%
Percentage of Offers: 79.0%
2023
Applicants: 14,636
Offers: 2,905
Success Rate: 19.8%
Percentage of Offers: 78.1%
2022
Applicants: 14,569
Offers: 2,806
Success Rate: 19.3%
Percentage of Offers: 77%
2021
Applicants: 14,401
Offers: 2,691
Success Rate: 18.7%
Percentage of Offers: 75.7%
2020
Applicants: 14,104
Offers: 2,950
Success Rate: 20.9%
Percentage of Offers: 75%
Cambridge
2025
Applicants: 14,842
Offers: 3,632
Success Rate: 24.5%
Percentage of Offers: 75.5%
2024
Applicants: 14,865
Offers: 3,633
Success Rate: 24.4%
Percentage of Offers: 75.5%
2023
Applicants: 14,636
Offers: 2,905
Success Rate: 19.8%
Percentage of Offers: 79.5%
2022
Applicants: 14,896
Offers: 3,242
Success Rate: 21.8%
Percentage of Offers: 76.5%
2021
Applicants: 14,804
Offers: 2,866
Success Rate: 19.4%
Percentage of Offers: 67.3%
2020
Applicants: 13,388
Offers: 3,122
Success Rate: 23.3%
Percentage of Offers: 66.3%
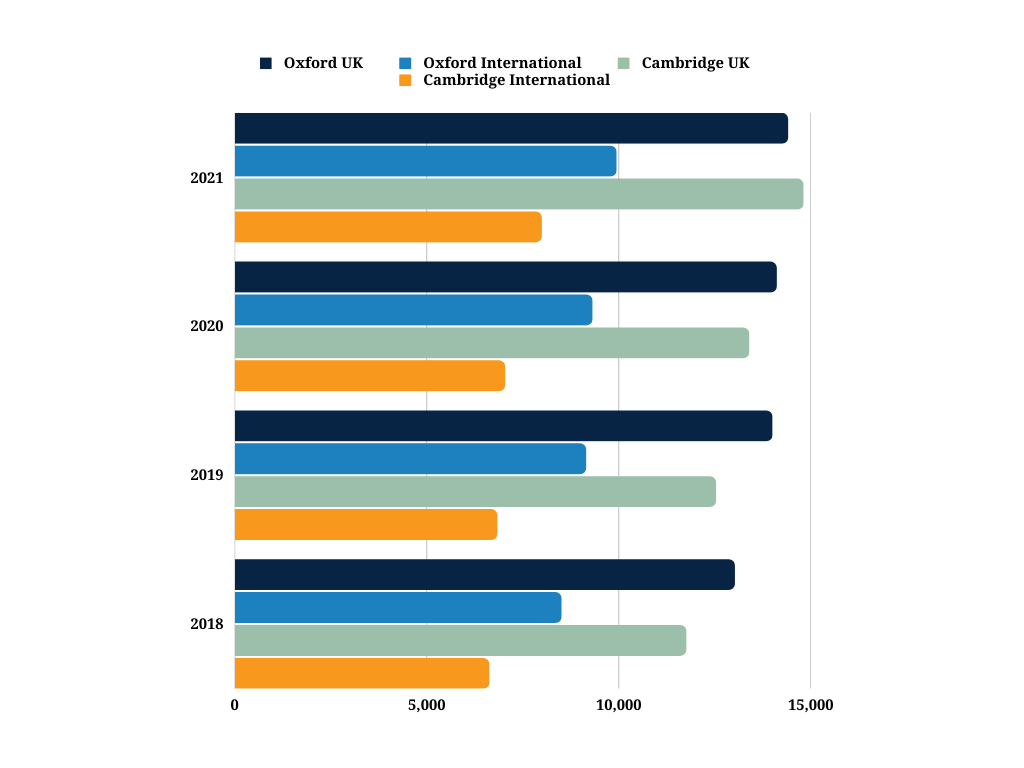
UK vs International Oxbridge Applicants
UK vs International Oxbridge Offers
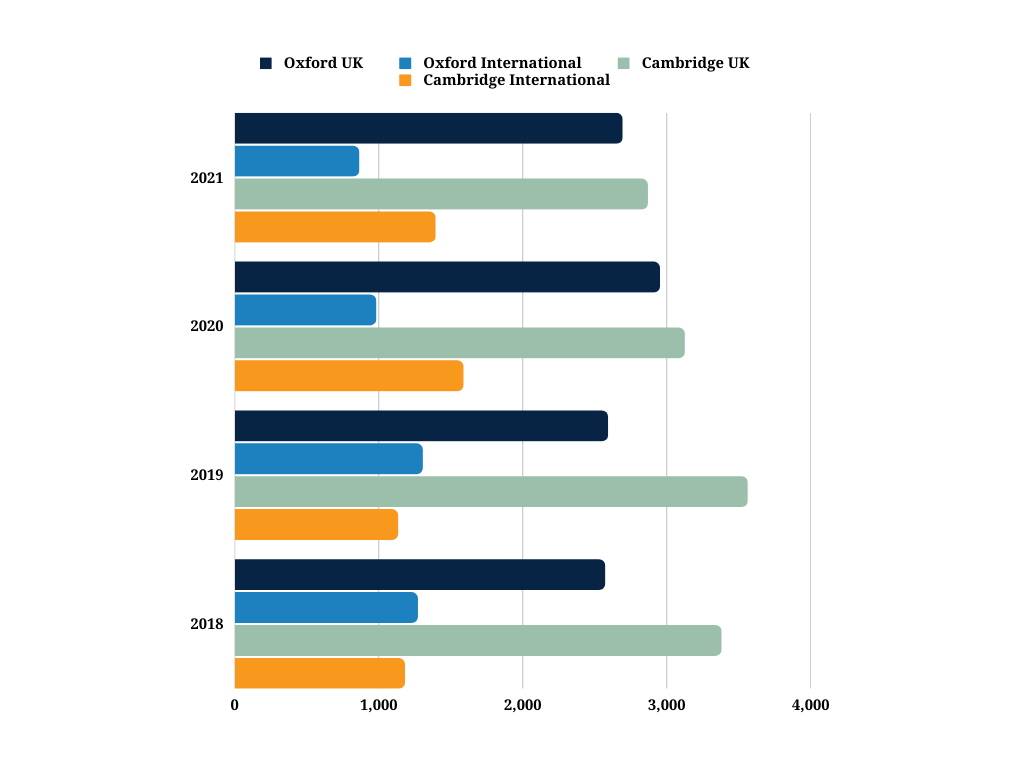
UK applicants still make up the large majority of applicants and offer-holders, although these figures do seem to be changing in opposite directions. Oxford seems to be receiving and admitting fewer international applications while Cambridge is accepting more. None of this should have a major impact on your UK applicants but it’s good to be knowledgeable on the current statistics.
These statistics aren’t just useful for seeing applicant data, as we can also review statistics relating to each university’s performance and teaching capabilities. Here are two of the most important ones (both of these statistics are based on 2024 performance and are provided by The Guardian’s 2024 University Table):
Student-to-Staff Ratio
When advising students on why Oxbridge stands apart, the student-to-staff ratio is one of the most concrete points you can make. A lower figure means more contact time, more personalised feedback, and a more rigorous academic environment. Both Oxford and Cambridge already lead the UK on this measure, and their ratios have continued to fall.
Oxford Student-to-Staff Ratio
2025: 10
2024: 10.3
2023: 10.5
2022: 10.1
2021: 10.3
Cambridge Student-to-Staff Ratio
2025: 9.4
2024: 11.6
2023: 11.6
2022: 11.4
2021: 11.2
Oxbridge Employment Rates
Attending a university course is primarily about the end result; your students’ future careers. Therefore, high employment rates are important to maintain for universities with as high reputations as Oxford and Cambridge. Thankfully, they do maintain this year-on-year:
Oxford Employment rate 2024
94%
Cambridge Employment rate 2024
94%
More Oxbridge Data
We have a wide selection of guides available delving deeper into more Oxbridge and university data. If you are interested in where Oxford and Cambridge place on the various University Ranking Tables available, then our Ranking guides are the best place to begin your research:
Oxbridge Admissions Tests are a major part of the admissions process, so understanding the results that your students need to achieve is important. Not only can we help you with that, we have also gathered data from previous admissions cycles to help you see the success rates of applicants and determine trends that have occurred throughout the years. Check out our Admissions Test Results Guides here:
All of this data is a good starting point for you and your student’s research, but it is now time to dig a bit deeper into specific areas, starting with school types:
Target Grades for Oxbridge Applicants
Oxford and Cambridge aren’t known for providing Unconditional Offers to their applicants, so you and your students are going to need to ensure they put the work in to achieve the expected grades for their course.
Minimum requirements for courses at each university remain fairly consistent from course to course, although there is some variance in certain subjects. Here is a rough overview of what grades your students should be aiming for:
Oxford Grade Requirements
The conditional offers for Oxford vary based on the subject but will typically require A*A*A to AAA grades at A Level or 38-40 points in the IB, including core points, with specific grades possibly being required at the Higher Level.
Oxford medicine Grade Requirements
| A-Levels | A*AA with an A Grade in Chemistry and either Mathematics, Biology or Physics. |
| Advanced Highers | AA at Advanced Highers with AAAAA in Highers with Chemistry and either Mathematics, Biology or Physics. |
Oxford Law Grade Requirements
| A-Levels | AAA |
| Advanced Highers | AAB |
Oxford Economics & Management Grade Requirements
| A-Levels | A*AA with A Grade in Mathematics |
| Advanced Highers | AA/AAB |
Oxford Engineering Science Grade Requirements
| A-Levels | A*A*A with A* Grades in Mathematics and Physics |
| Advanced Highers | AA/AAB |
Cambridge Grade Requirements
For most Science courses, Cambridge typically requires A*AA at A Level, and for Arts/Humanities courses, AAA, or 40-42 points in the IB, including core points, with 776 at Higher Level.
Cambridge medicine Grade Requirements
| A-Levels | A*A*A with grades in Chemistry and either Mathematics, Biology or Physics |
| Advanced Highers | A1, A1, A2 with grades in Chemistry and either Mathematics, Biology or Physics |
Cambridge Law Grade Requirements
| A-Levels | A*AA |
| Advanced Highers | A1, A2, A2 |
Cambridge Economics Grade Requirements
| A-Levels | A*A*A with Mathematics |
| Advanced Highers | A1, A1, A2 |
Cambridge Engineering Grade Requirements
| A-Levels | A*A*A with Mathematics and Physics |
| Advanced Highers | A1, A1, A2 |
State Vs Independent Schools: Oxbridge Admission Rates
Over the years, there has been much controversy over the rates of admission between state and independent schools. This is due to concerns over heavily skewed results towards independent schools followed by a course correction that some felt disadvantages those in private schools due to quotas.
Essentially, the stereotype was that Oxbridge was for those with greater financial support, evidenced by disproportionate percentages of admitted independent school students vs state schools. However, the data made available from the last few years paints a different picture:
State School Oxbridge Applicants
| Year Of Entry | Applicants | Offers | % Of Offers | Applicants | Offers | % Of Offers |
| 2024 | 10,258 | 1,964 | 51.8% | 10,258 | 2,524 | 53.0% |
| 2023 | 10,150 | 1,935 | 69.3% | 9,491 | 2,423 | 70.9% |
| 2022 | 9,965 | 1,851 | 69.4% | 10,134 | 2,324 | 74.0% |
| 2021 | 9,608 | 1,760 | 68.2% | 10,058 | 2,218 | 69.8% |
| 2020 | 9,411 | 1,937 | 68.2% | 9,237 | 2,477 | 69.7% |
| 2019 | 8,914 | 1,557 | 62.3% | 8,470 | 2,443 | 68.6% |
independent School Oxbridge Applicants
| Year Of Entry | Applicants | Offers | % Of Offers | Applicants | Offers | % Of Offers |
| 2024 | 3,852 | 933 | 24.6% | 3,593 | 901 | 18.9% |
| 2023 | 3,797 | 858 | 30.7% | 3,503 | 842 | 24.6% |
| 2022 | 3,855 | 815 | 30.6% | 3,909 | 816 | 26% |
| 2021 | 4,101 | 819 | 31.8% | 3,809 | 844 | 30.2% |
| 2020 | 4,069 | 886 | 31.4% | 3,436 | 960 | 30.3% |
| 2019 | 4,402 | 942 | 37.7% | 3,295 | 999 | 31.4% |
As you can see, applicants from state schools make up a fairly large majority, as well as receiving more offers overall. Success rates are still also comparable, with state schools achieving a 19% Oxford success rate in 2021 compared to 20% from independent schools. However, these figures are always changing from year-to-year so figures from last year won’t truly reflect what will happen in the next admissions cycle.
Subject Competitiveness at Oxbridge
We’ve seen the success rates for applicants at Oxbridge, but this paints a very broad picture. In reality, the general success rate for the universities is nowhere near as important as the success rate for your students’ specific courses. Some of these courses are much more competitive or have far fewer slots than others, meaning success rates across courses can vary wildly.
We’ve collected the admissions data from some of the top courses at Oxford and Cambridge to help you get started in analysing subject-specific admissions data. Let’s take a look:
Oxbridge Medicine Offer Rates
| Year | Oxford Offer Rate | Cambridge Offer Rate |
|---|---|---|
| 2025 | 15% | 20.0% |
| 2024 | 11.3% | 16.1% |
| 2023 | 9.5% | 16.4% |
| 2022 | 8.8% | 14.5% |
| 2021 | 8.6% | 13.4% |
| 2020 | 7.6% | 16.2% |
Oxbridge Law Offer Rates
| Year | Oxford Offer Rate | Cambridge Offer Rate |
|---|---|---|
| 2025 | 13% | 17.6% |
| 2024 | 11.5% | 14.7% |
| 2023 | 11.8% | 17.7% |
| 2022 | 11.2% | 13.3% |
| 2021 | 11.1% | 13.2% |
| 2020 | 14.6% | 17% |
Oxbridge Economics Offer Rates
| Year | Oxford Offer Rate | Cambridge Offer Rate |
|---|---|---|
| 2025 | 6% | 11.8% |
| 2024 | 6.1% | 12.5% |
| 2023 | 5.9% | 13.7% |
| 2022 | 5.8% | 10.9% |
| 2021 | 5.3% | 10.0% |
| 2020 | 5.2% | 12.1% |
Oxbridge Engineering Offer Rates
| Year | Oxford Offer Rate | Cambridge Offer Rate |
|---|---|---|
| 2025 | 16% | 12.0% |
| 2024 | 17.9% | 14.0% |
| 2023 | 19.0% | 15.4% |
| 2022 | 17.9% | 14.4% |
| 2021 | 17.6% | 12.4% |
| 2020 | 17.8% | 14.4% |
Oxbridge Mathematics Success Rates
| Year | Oxford Offer Rate | Cambridge Offer Rate |
|---|---|---|
| 2025 | 10% | 27.3% |
| 2024 | 10.5% | 29.2% |
| 2023 | 10.7% | 33.0% |
| 2022 | 10.8% | 25.3% |
| 2021 | 9.9% | 14.5% |
| 2020 | 10.2% | 16.7% |
Oxbridge English Success Rates
| Year | Oxford Offer Rate | Cambridge Offer Rate |
|---|---|---|
| 2025 | 24% | 36.9% |
| 2024 | 27.3% | 32.0% |
| 2023 | 25.5% | 29.4% |
| 2022 | 25.1% | 25.9% |
| 2021 | 24.8% | 25.2% |
| 2020 | 24.4% | 31.8% |
Oxbridge PPE/HSPS Success Rates
| Year | Oxford PPE Offer Rate | Cambridge HSPS Offer Rate |
|---|---|---|
| 2025 | 14% | 19.2% |
| 2024 | 15.2% | 18.1% |
| 2023 | 14.2% | 15.3% |
| 2022 | 13.4% | 12.7% |
| 2021 | 13.2% | 12.7% |
| 2020 | 11.2% | 19.5% |
So what can we learn from all of these figures? Firstly, we can see that the most competitive courses in Oxbridge include Oxford Economics, Medicine and Mathematics, which all average out at below a 10% success rate. To explore subject competitiveness across all UK universities, our guide The Most Competitive Degrees in the UK is a useful companion read. Meanwhile, the least competitive courses include Science and English, with Cambridge’s English course even hitting a 32% success rate in 2024.
Oxford is generally more competitive judging by these success rates, as they don’t have any courses with generally higher success rates. This is also true of their shortlisting process as they will typically interview up to 40% of their applicants, around 20% – 30% less than Cambridge.
This is only a small number of the courses available at Oxbridge, but the data for every course will be available in one form or another. Let’s learn more about how you find and use this data yourself.
Become an Oxbridge expert with our free CPD-accredited course.
1
Includes 3 hours of content and knowledge quizzes.
2
Completely free for teachers and schools.
3
Upon completion, you will gain CPD points!

Where Can You Gather Oxbridge Data?
The data we have presented here is all incredibly useful but the rabbit hole goes much deeper than this. You will be able to find data on incredibly niche topics and sort through information with a fine-tooth comb to learn more about specific demographics of applicants. However, it takes knowledge and work to do so.
Firstly, let’s take a look at the best official sources of data from Oxford and Cambridge:
Official University Websites
Their admissions reports in particular are very detailed, breaking down the data in numerous ways to display the statistics based on subject, school types, sex and much more. These reports are worth reading and are perfect for referencing if you have any relevant questions. Check them out below:
University Department Websites
Each department at Oxford and Cambridge will have their own website where they provide newsletters, information on courses and data reports. These data reports can relate to admissions test scores, exam results and admissions data, so be sure to check them out if you have a student looking to study a specific subject.
College Wesbites
If you are looking for college-specific data, most colleges have websites that provide updates regarding their students and admissions. On these sites, you can find reports relating to general admissions and admissions test scores, but you may also find information regarding applicant interview performances if the college in question uses a specific system for judging interviewees. This kind of data is much less common so it is always useful when it’s available.
4
Freedom of Information Requests
Under the FOIA, any person can request access to records, documents, or other information that is maintained by public authorities, which includes universities. There are some exceptions to the types of information that can be released, including national security, personal data, and commercial interests. If the public authority decides to withhold information, they must provide a reason for doing so.
If a piece of information you are looking for is not available on any official report provided by Oxford or Cambridge, then you may be able to find it via WhatDoTheyKnow thanks to the Freedom of Information Act (FOIA).
Many requests have already been made to Oxford and Cambridge (as well as every other UK university), so this data will be freely available for anyone to view. In order to get the best results when searching for data, you need to be very clear about your search intent (create a search along the lines “University of Cambridge NSAA results 2019” for example). Most of the time, the data will be presented in text or within a table, though some of these data sets can be very long and difficult to interpret.
5
University Rankings
Each year, multiple organisations, including Complete University Guide and The Guardian, rank universities based on a variety of criteria. These include student satisfaction levels, graduate employment rates and practical figures like student-to-staff ratios. This data can be helpful in many cases, so it’s worth checking the university rankings for relevant subjects each year. However, they aren’t a definitive measure of a university’s quality, so don’t encourage students to rely on them for their decision-making.
How Should I Use This Oxbridge Data?
Now that you have the data available to you, you may be wondering what you should be doing with it all. Here are a few ideas of ways you can use admissions data to improve your student’s application preparation:
Subject Competitiveness
As you have already seen, different subjects at Oxford and Cambridge have different levels of competitiveness based on the percentage of applicants admitted each year. By gathering yearly success rates for all of the subjects that your students are considering, you can see which ones will be more difficult to apply to. Having this insight will help both you and your student understand the challenges that face them, allowing you both to prepare effectively to boost their chances of success.
Demographic Data
Although it may feel outdated by today’s standards, the data relating to different demographics of applicants do still display certain trends. Although the differences are often negligible, it will still be important to consider as certain factors could make your students more or less likely to receive an offer, at least on paper. In reality, the Oxbridge application process ensures that discrimination of any kind is not present, so take the data with a pinch of salt.
Data Trends
A major benefit of gathering data across multiple years is that it allows you to analyse trends over time, offering further insight into the changing landscape of a subject. For example, 2020 and 2021 saw a relatively sharp increase in medicine applicants across the UK. This may have been influenced by the COVID-19 pandemic, which brought healthcare careers into sharper public focus, alongside wider changes in university admissions and applicant behaviour during that period. Trends are often shaped by real-world events or changes within a course itself, so it can be a useful exercise to explore with students why certain figures look the way they do.
Predictive Analysis
Analysing the cause of data trends is one helpful application of admissions data, but you can also attempt to make predictions of future admissions cycles based on previous years and current events. It goes without saying but it is impossible to provide an accurate prediction for the future to your students, so this should be done more as an exercise in hypotheticals and data analysis than as serious guidance.
Motivation
Without having a point of reference to their chances of gaining an offer, many students will feel less motivated to put in the work for their application, either because they are unaware of how few students are admitted each year or are worried that their chances of success are next to impossible. Having an accurate and definitive figure for how many applicants are admitted to a certain subject will help them understand exactly how much effort is required to improve their chances of success.
UniAdmissions' Teacher Tips
- Much of this data will be available for any university in the UK, so don’t feel that this advice is only relevant to Oxbridge. Although some universities are less diligent with uploading admissions reports for their courses, you always have the option of FOI Requests if you need a certain piece of information.
You should now have a good understanding of why data is so important for the Oxbridge application process for both you and your students. We aren’t expecting you to remember all of these figures, so be sure to have a point of reference with all the information you need. You could create your own spreadsheet, have a file of application data reports or even download our free Oxbridge Data Infographic, which can be used by both teachers and students.
Whatever you decide to do next, do so with these important figures and data sets in mind to ensure you and your students are working with all the necessary information.
If you would like to share this information with your students, you can download our free infographic, covering some of the most important facts and figures we have presented in this guide. Remember to read through our other guides in order to get a greater understanding of how the Oxbridge application process works, and find out how UniAdmissions can support your school in creating the ultimate support programme for your students.
Other Helpful Oxbridge Resources
Free CPD-Accredited Oxbridge Counsellor Course
This free online course is designed to equip you with the knowledge and skills needed to help your students secure a place at the world’s top universities. You’ll complete the course as an Oxbridge expert!
Teacher’s Oxbridge Learning Hub
Access all of our highly detailed written guides for teachers, as well as useful resources and information about our school support.
Frequently Asked Questions
Both Oxford and Cambridge publish new admissions reports annually, typically a few months after each admissions cycle concludes. At UniAdmissions, we update our guides every time new data is available, so it might be worth adding this guide to your bookmarks adn come back to it regularly,
Selectively, yes. Data like subject offer rates and student-to-staff ratios can be genuinely motivating and help students make informed choices. However, be mindful of how you frame very low acceptance rates, as the goal is to inform and prepare, not discourage.


