

5 things to know
Key Takeaways
- LSE was the hardest Russell Group university to get into for 2025 entry, based on the universities that publish their admissions data. The London School of Economics made offers to just 16.1% of its 29,653 undergraduate applicants and admitted 6.6% of them, the lowest offer and acceptance rates in the group. Oxford had the next-lowest offer rate, at 16.7%.
- At Oxford and Cambridge, getting the offer is the hard part. Oxford made offers to 16.7% of applicants for 2025 entry and admitted 14.2%, while Cambridge made offers to 21.7% and admitted 16.3%. Most Oxbridge offer holders go on to take up their place, whereas at universities like Edinburgh, King's College London and Warwick, only around one in four or five offer holders ended up enrolling.
- Some Russell Group universities make offers to most of their applicants. Durham and Warwick each made offers to 76.9% of undergraduate applicants for 2025 entry, and Sheffield's most recent published offer rate was 78.6% (2022 entry). A high offer rate doesn't mean a place is guaranteed, though: Warwick admitted 15.5% of its applicants in 2025.
- Offer rates have been rising at several Russell Group universities, led by UCL. UCL received 89,239 applications for 2025 entry, the most of any Russell Group university with published data, and made offers to 43.4% of them, up from 24.9% for 2023 entry. Edinburgh's offer rate climbed from 33.3% for 2022 entry to 52.6% for 2025 entry, and Warwick's from 60.7% to 76.9% over the same period. Imperial and LSE are the exceptions, with offer rates falling slightly to 24.0% and 16.1% respectively for 2025 entry.
- Only 14 of the 24 Russell Group universities publish whole-university offer data. Birmingham, Cardiff, Exeter, Liverpool, Manchester, Nottingham, Queen Mary, Queen's University Belfast, Southampton and York don't release overall application and offer figures, so any acceptance rate you see quoted for them online can't be verified. Course-level data is a better guide where it exists: for example, Birmingham made offers to 60.3% of home applicants to its A100 Medicine course for 2026 entry.
If you’re planning to apply to the top universities in your chosen field, you’re more than likely going to be applying to at least one Russell Group university.
For over 30 years, the Russell Group has housed 24 of the UK’s highest-ranked universities. These include some of the most popular universities in the world, including Oxford, Cambridge and Imperial College London.
However, as these universities are so popular, they are also highly competitive, with tough entry requirements and hundreds – if not thousands – of equally qualified applicants applying for spaces in each course. As a result, getting your offer and confirmed place is far from easy.
In this guide, we’ll be exploring the aspect of Russell Group applications that is incredibly important for many people – the admissions statistics and acceptance rates.
Russell Group Universities
Want to skip to a specific university’s acceptance rates? Select your choice below:
- London School of Economics (LSE)
- University of Manchester
- Newcastle University
- University of Nottingham
- University of Oxford
- Queen Mary University of London
- Queen's University Belfast
- University of Sheffield
- University of Southampton
- University College London (UCL)
- University of Warwick
- University of York
What Are Acceptance Rates?
Before we look into the data, we need to understand what we are actually looking at. Throughout this guide, we’ll be focussing on five key pieces of data per university:
- Applications
- Offers
- Acceptances
- Offer Rate
- Acceptance Rate
The first three are very simple: they’re the number of applications received, offers sent and total accepted students at a university each year. The last two are slightly more complicated but still fairly simple. The acceptance rate is the percentage of students who got their place at the end of the admissions cycle versus the number of applicants. We would calculate this like so:
Number of admitted applicants/Total number of applicants
The same would be done for applicants who were offered a place. This figure is always higher than the acceptance rate, as not everyone who receives an offer will be admitted. Some may decline the offer, while others may not meet the required exam grades.
During the application process, offer rates are generally the most important factor as they will indicate the likelihood of getting your offer to study there, whereas the acceptance rate just displays how many applicants dropped out after receiving an offer. If you’re dedicated to studying at a specific place, getting an offer should hopefully mean you’ll get your place, as long as you meet the required grades.
What Admissions Data is Available?
For many universities, we have access to the data listed above. In this guide, we will be considering this data for the overall undergraduate intake of each university, it is often possible to narrow down this data to a specific course/degree or – in the cases of Oxford and Cambridge – a specific college within the university.
Some universities will go further than this, offering insight into the regions, ethnicities, genders and socioeconomic backgrounds of their application cohort. This kind of data can be extremely useful, although navigating through it all can be overwhelming, especially when looking at multiple universities.
Where Do You Find University Admissions Data?
University admissions data can come from various places, though some sources are more reliable than others. The best source for admissions data is the universities themselves. Some of the Russell Group universities will publish annual reports or data tables covering admissions data based on courses, locations demographics and more. These are incredibly reliable sources of data because they have been specifically reported by the primary sourse.
Another way that universities may publish admissions data is through Freedom of Information Requests (FOI). Universities, as with many other government and public organisations in the UK, are legally obliged to offer certain kinds of information to the public when requested, including admissions data (when individual data isn’t at risk of being released).
While this theoretically means that admissions data for all universities should be available, this isn’t the case. One of the grounds for refusal to complete an FOI request is if the data is already available elsewhere, which it technically is via the University and College Admissions Service (UCAS), specifically UCAS Exact.
This service houses all of the data collected by UCAS – who facilitate all university applications in the UK – for each admissions cycle. While this means the data is available, it is also very costly to obtain and cannot always be made available to the public. This means that for most individuals trying to research university options, this will not be a viable option.
When searching for university acceptance rates online, you may find independent sources providing data for universities. However, take these figures with a grain of salt, as the source of this data will often not be directly linked to or even referenced. Some of this data may be accurate but don’t take anything as fact unless reported by the university itself.
Lastly, one source of data that covers every Russell Group university is the Higher Education Statistics Agency (HESA). HESA offers data on how many undergraduate applicants entered each university each year at each university. While this is useful information to have, it is once again important to consider it with caution, as the data provided here often contradicts the information provided in official university admissions reports (although it usually isn’t too far off).
You can learn more about how to use this information in our dedicated guide to making the most of university admissions data.
Less than 16% of Oxbridge applicants got their place, but 67% of UniAdmissions students got their Oxbridge offer.
If you want the best chance of getting into Oxbridge, as well as other Russell Group universities, enrol on a Full-Blue Programme to receive world-class application support from start to finish. Our students have access to expert resources, one-to-one tuition sessions, intensive courses and much more, all designed to give them the best possible chance of success.
Discover our Full-Blue Programme by clicking the button below to learn how you can enrol and triple your chances of success.
Russell Group University Acceptance Rates
Below are all of the available admissions statistics for all 24 Russell Group universities. Unfortunately, not all of these universities provide reports containing this information, so we haven’t been able to include all of the necessary information.
We have covered any data reported as far back as the 2021/22 admissions cycle. It’s important to see multiple years of data where possible, as you will be able to see trends in admissions rather than a single snapshot. This data only covers undergraduate admissions and offers an overall figure for all relevant courses.
For medicine-specific admissions statistics, check out our guide G5 Medical School Acceptance Rates – 2025 Guide, where we analyse multiple year data for medicine applications across all G5 universities.
University of Birmingham Acceptance Rate
The University of Birmingham doesn’t publish admissions statistics for its whole undergraduate intake, so there is no official overall acceptance rate for the university. HESA reports that Birmingham had 7,175 new undergraduate students in 2023 and 8,365 in 2022, but these are intake numbers rather than acceptance rates.
Birmingham Medical School does publish detailed admissions data for its five-year A100 Medicine course. According to its MBChB Admissions Statistics (September 2026), Birmingham made offers to 60.3% of home applicants for 2026 entry (985 offers from 1,633 applications), and 346 had enrolled as of 28 August 2026.
Birmingham’s home offer rate for Medicine has risen every year since 2023, from 34.0% to 60.3%. Over the same period, home applications fell from 2,299 for 2023 entry to 1,503 for 2025 entry, before rising slightly to 1,633 for 2026. In other words, Birmingham has been making more offers to a smaller pool of applicants, which is good news if Birmingham is on your list.
Keep in mind that the enrolled figures are early-September snapshots, so they don’t include deferrals or places filled through Clearing. Birmingham reports that 381 home students were placed in total for 2026 entry.
International applicants face much stiffer competition. For 2026 entry, Birmingham made 93 offers from 460 international applications (a 20.2% offer rate), and 28 international students had enrolled by 28 August 2026.
Medicine is one of the most competitive degrees in the UK, so these figures shouldn’t be taken as a guide to Birmingham’s other courses, many of which are likely to be less competitive.
University of Bristol Acceptance Rate
2022 Entry
Applicants: 61,030
Offers: 33,545
Acceptances: 7,315
Offer Rate: 55.0%
Acceptance Rate: 12.0%
Based on data published by the University of Bristol, the university sent out offers to 55% of its undergraduate applicants in 2022 across all faculties. Despite this, only 12% of applicants were ultimately admitted. Interestingly, the university also reported a separate figure for students, which was 5,820 (9.5% of applicants). Be aware that these statistics are rounded to the nearest five applicants, so the figures aren’t 100% accurate.
University of Cambridge Acceptance Rate
2025 Entry
Applicants: 22,820
Offers: 4,947
Acceptances: 3,716
Offer Rate: 21.7%
Acceptance Rate: 16.3%
2024 Entry
Applicants: 22,153
Offers: 4,760
Acceptances: 3,632
Offer Rate: 21.5%
Acceptance Rate: 16.4%
2023 Entry
Applicants: 21,445
Offers: 4,553
Acceptances: 3,557
Offer Rate: 21.2%
Acceptance Rate: 16.6%
2022 Entry
Applicants: 22,470
Offers: 4,238
Acceptances: 3,544
Offer Rate: 18.9%
Acceptance Rate: 15.8%
The University of Cambridge offers a comprehensive report of its admissions data each year in May/June. These reports cover a wide variety of topics and break down their admissions by many different parameters. These reports are available online as far back as 2000, although the data is far more limited in earlier reports.
As we can see from the data, offers and acceptances have been up since 2023, although applications only overtook 2022 in 2025. While the offer rate has increased each year, the acceptance rate has consistently dropped, though only by a very small margin. If you want to learn more about the individual admissions stats for each Cambridge course, discover our Cambridge Acceptance Rates Guide here, as well as our Cambridge College Acceptance Rates Guide if you want to learn more about the colleges’ admissions stats.

Cardiff University Acceptance Rate
Cardiff University is another that doesn’t provide extensive data on its annual admissions, so no solid acceptance rate is available. The university claims to have 23,970 undergraduates in total and HESA reported 8,730 new students in 2023.
However, FOI requests have been completed that feature admissions data for multiple courses, including Medicine and Law. From this data, we can see that Law had a 35% offer rate and 17% acceptance rate in 2023. In 2024, A100 Medicine had 4,036 applicants, of which 1,159 were interviewed (28.7%) and 622 were given offers (15.4%).
Durham University Acceptance Rate
2025 Entry
Applicants: 35,130
Offers: 27,005
Acceptances: NA
Offer Rate: 76.9%
Acceptance Rate: NA
Durham released a report of offer data for all undergraduate courses in 2025, though acceptance data is missing. However, these statistics show that, despite Durham being one of the most popular universities in the UK, its offer rate is surprisingly high.
In the report, we can see that the most popular department was Law, with 2,855 applicants (1,085 of which were from overseas). The offer rate was 49%. The data in the report is rounded to five, so keep in mind that the figures aren’t 100% accurate.
University of Edinburgh Acceptance Rate
The University of Edinburgh releases overall admissions data each year, limited to applications, offers and acceptances:
2025 Entry
Applicants: 68,862
Offers: 36,195
Acceptances: 7,626
Offer Rate: 52.6%
Acceptance Rate: 11.1%
2024 Entry
Applicants: 65,583
Offers: 30,766
Acceptances: 7,203
Offer Rate: 46.9%
Acceptance Rate: 11.0%
2023 Entry
Applicants: 68,650
Offers: 27,224
Acceptances: 6,328
Offer Rate: 39.7%
Acceptance Rate: 9.2%
2022 Entry
Applicants: 74,782
Offers: 24,868
Acceptances: 6,067
Offer Rate: 33.3%
Acceptance Rate: 8.1%
2021 Entry
Applicants: 68,278
Offers: 32,013
Acceptances: 8,035
Offer Rate: 46.9%
Acceptance Rate: 11.8%
The University of Edinburgh made offers to 52.6% of undergraduate applicants for 2025 entry (36,195 offers from 68,862 applications), its highest offer rate in the last five admissions cycles. Offers have risen every year since a sharp drop between 2021 and 2022, while applications have held fairly steady since 2023 at around 65,000 to 69,000, so the offer rate has climbed from 33.3% in 2022. Edinburgh also publishes separate statistics for Scotland, Rest of UK and Overseas fee-paying applicants; because the Scottish Government limits the number of Scotland-fee places, offer rates can differ noticeably between these groups, so it’s worth checking the figures for your own fee status.

University of Exeter Acceptance Rate
No admissions data is readily available for the University of Exeter. HESA reports that the university saw around 8,730 new undergraduates in 2023, while the official website states that there were 22,846 undergraduates in total last year. This is a fairly standard cohort size for a UK university, though we cannot decipher how difficult it is to get a place based on this data.
University of Glasgow Acceptance Rate
Data for the University of Glasgow’s admissions statistics are not easily accessible, although some of the required data has been released via FOI requests. This includes all of the required data for the 2022 admissions cycle:
2022 Entry
Applicants: 42,901
Offers: 24,994
Acceptances: 6,366
Offer Rate: 58.3%
Acceptance Rate: 14.8%
Glasgow had much higher offer and acceptance rates compared to the other Scottish Russell Group university, Edinburgh. There were over 30,000 fewer applicants at Glasgow, though it sent out a comparable amount of offers and admitted more students in 2022. We also have details from 2023 in the form of a presentation, which states that the average offer rate for home applicants was 65%.
Home offer rates for several major subjects are also revealed, including Medicine (53%), Law (57%) and Computer Science (38%). Overall, Glasgow appears to be one of the less competitive universities in the Russell Group.
Imperial College London Acceptance Rate
2025 Entry
Applicants: 33,923
Offers: 8,143
Acceptances: 3,627
Offer Rate: 24.0%
Acceptance Rate: 10.7%
2024 Entry
Applicants: 32,887
Offers: 8,264
Acceptances: 3,474
Offer Rate: 25.1%
Acceptance Rate: 10.6%
2023 Entry
Applicants: 30,739
Offers: 7,948
Acceptances: 3,137
Offer Rate: 25.9%
Acceptance Rate: 10.2%
2022 Entry
Applicants: 28,877
Offers: 7,616
Acceptances: 3,092
Offer Rate: 26.4%
Acceptance Rate: 10.7%
Imperial College London offers a comprehensive report of their application data each year, which covers multiple years of admissions. From this data, we can see that the university receives a similar amount of applications to other Russell Group universities, but sends out far fewer offers and ultimately accepts around as many applicants as Oxford and Cambridge.
We have a full guide dedicated to Imperial Admissions Data, so be sure to check it out if you want to learn about the acceptance rates for each undergraduate subject taught at the university.

King's College London Acceptance Rate
2025 Entry
Applicants: 71,486
Offers: 32,277
Acceptances: 7,963
Offer Rate: 45.2%
Acceptance Rate: 11.1%
2024 Entry
Applicants: 70,252
Offers: 29,024
Acceptances: 7,710
Offer Rate: 41.3%
Acceptance Rate: 11.0%
From the data we do have, we can see that KCL had more applicants than many other Russell Group universities and gave out a lot of offers. However, the acceptance rate was fairly standard, despite having more students admitted than many other universities on this list. In 2025, its offer rate increased slightly, however, its acceptance rate remained stable. Our comprehensive KCL Acceptance Rate guide breaks down all KCL’s acceptance rates across all of its nine faculties as well as courses, so if you are applying to this institute we highly recommend reading it to see where your chances stand.
University of Leeds Acceptance Rate
2023 Entry
Applicants: 49,947
Offers: 23,474
Acceptances: 5,597
Offer Rate: 47.0%
Acceptance Rate: 11.2%
2022 Entry
Applicants: 49,572
Offers: 32,184
Acceptances: 7,500
Offer Rate: 64.9%
Acceptance Rate: 15.1%
The University of Leeds publishes admissions reports each year, so this data is based on the 2022 and 2023 reports. The offer rate in 2022 was incredibly high, while the acceptance rate was far closer to other Russell Group universities.
Both values dropped considerably in 2023. Despite receiving more applications for this year, the university sent almost 9,000 fewer offers and admitted around 2,000 fewer students. A cause for this drop is not immediately obvious, so it remains to be seen if any of these values dropped further in 2024.
University of Liverpool Acceptance Rate
The University of Liverpool hasn’t released substantial data regarding their admissions. The only data available is the intake statistics from HESA, which state that the university admitted around 7,330 students in 2023 and 7,715 in 2022. This would put Liverpool at a similar admissions rate to the University of Leeds, though this data isn’t fully reliable. Publicly reported acceptance rates for the university range from 25% to 75%, so these estimations don’t provide any useful insight.
Access "The Big Book Of Oxbridge Applications" For FREE
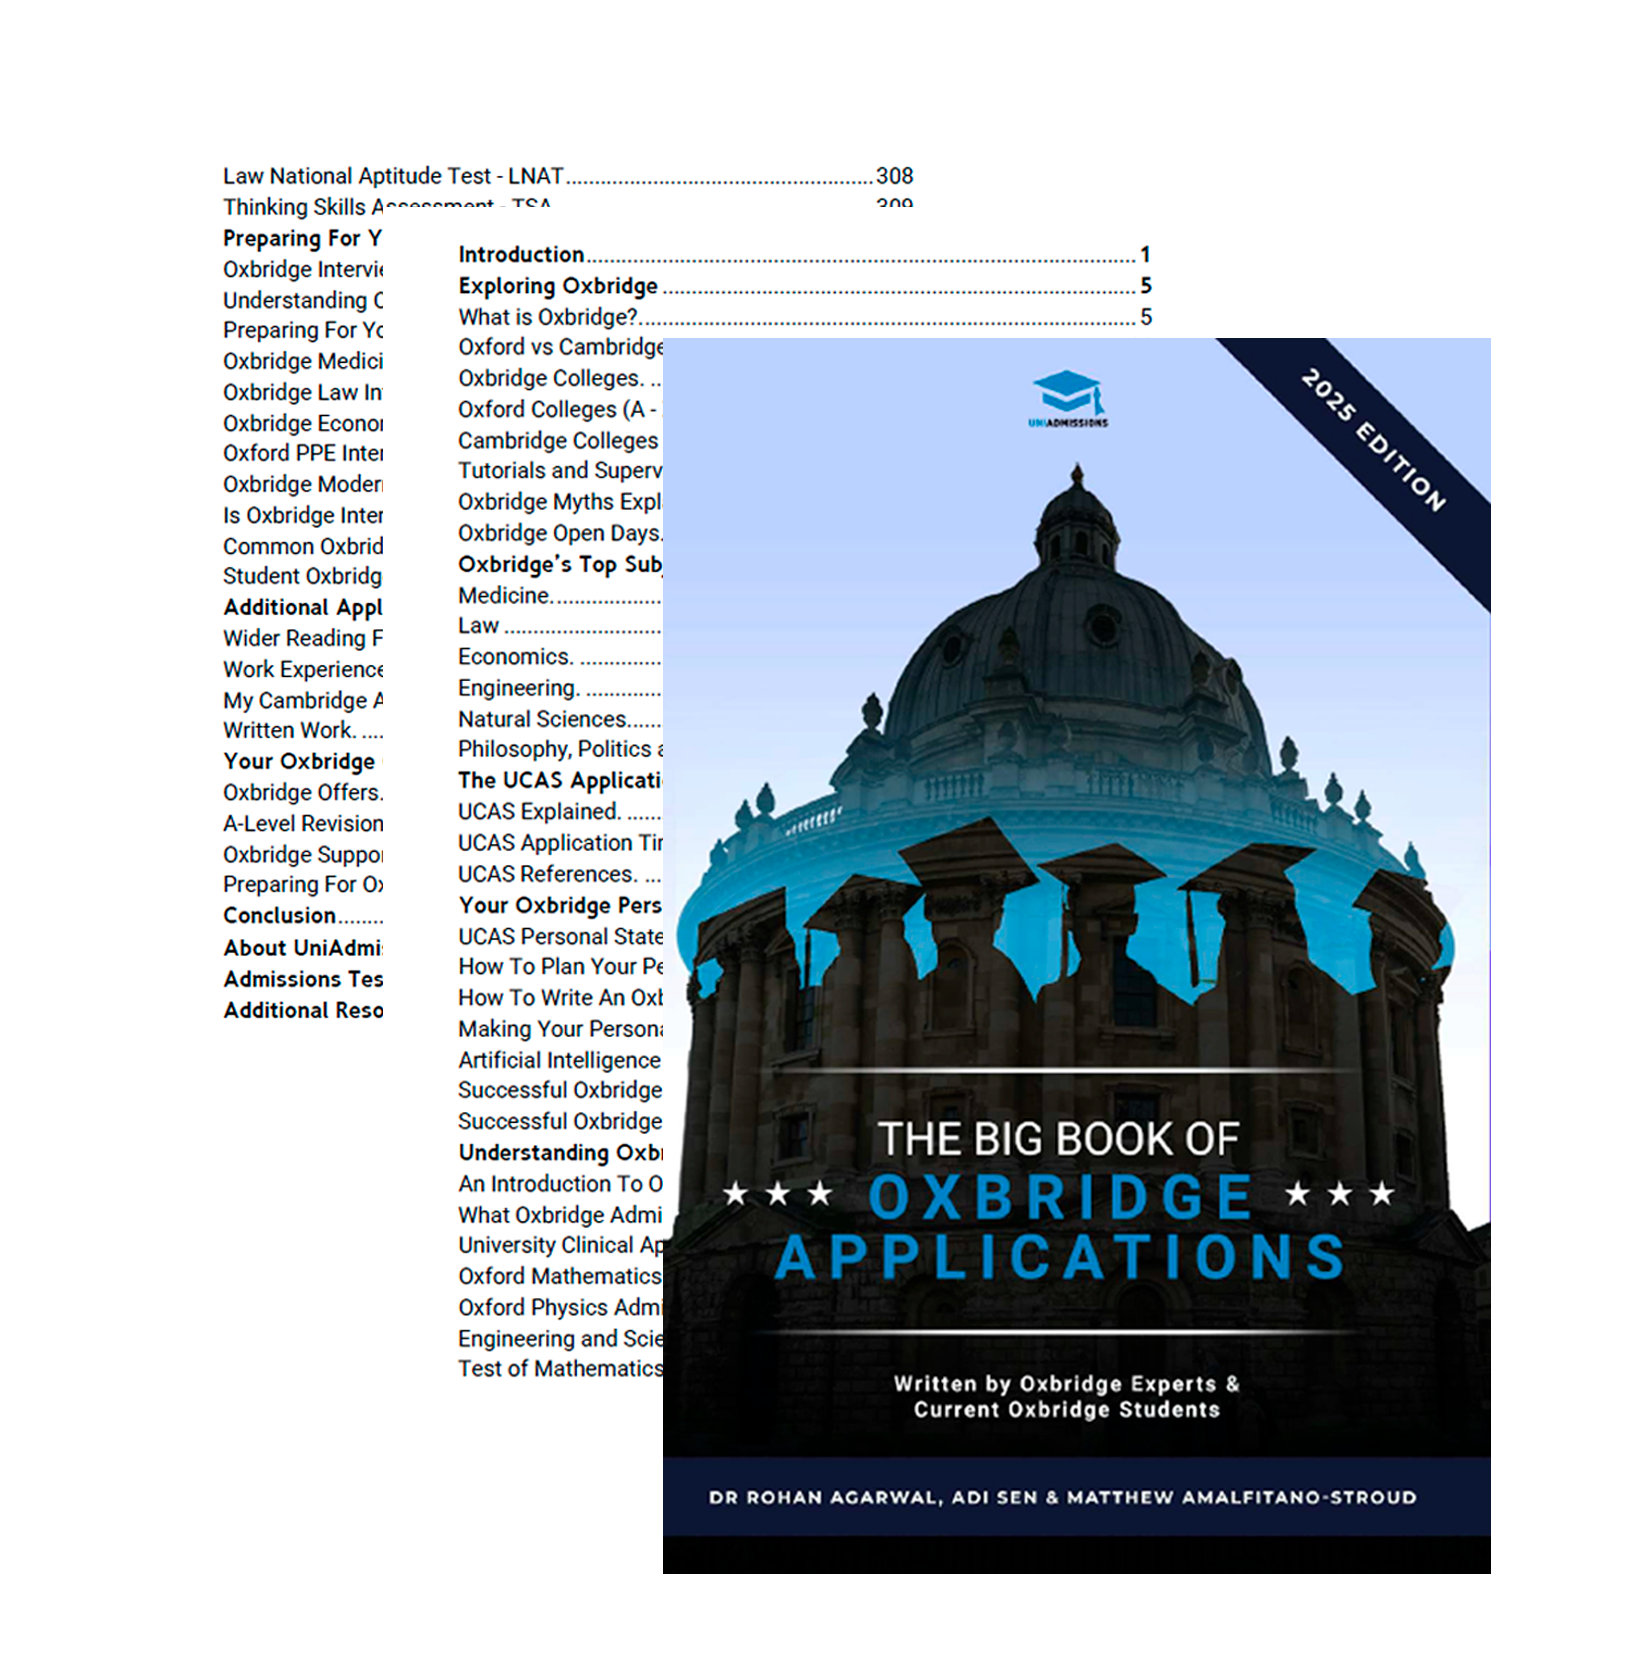
- Over 40 admissions test practice questions
- 28 example Oxbridge Personal Statements
- Interviews with Oxbridge students and graduates
- Additional downloadable resources
LSE Acceptance Rate (London School of Economics)
The London School of Economics has developed a Tableau that houses in-depth admissions data for multiple years, including 2025.
2025 Entry
Applicants: 29,654
Offers: 4,769
Acceptances: 1,965
Offer Rate: 16.1%
Acceptance Rate: 6.6%
2024 Entry
Applicants: 28,239
Offers: 4,612
Acceptances: 1,826
Offer Rate: 16.3%
Acceptance Rate: 6.5%
2023 Entry
Applicants: 26,446
Offers: 4,319
Acceptances: 1,773
Offer Rate: 16.4%
Acceptance Rate: 6.7%
2022 Entry
Applicants: 26,740
Offers: 4,594
Acceptances: 2,048
Offer Rate: 17.2%
Acceptance Rate: 7.7%
The data here indicates that LSE is potentially the most competitive university in the whole of the Russell Group, beating out even Oxford and Cambridge. The university has incredibly low intake numbers each year, rarely admitting more than 2,000 undergraduate students. Despite this, it receives a similar number of applications to Oxbridge universities, which culminates into an acceptance rate of under 10% each year (although offer rates are fairly standard when compared to other Russell Group universities).
A key reason for this low acceptance rate could be due to the limited amount of courses available at LSE. The university specialises in finance, law and humanities, not providing many sciences or arts courses. Beyond this, many courses have high entry requirements, leading to many offer holders not getting in. However, applicants who do meet the requirements may end up attending other high-end institutes instead, like Oxford and Cambridge. Even considering this, the university is still one of the most competitive in the country.

University of Manchester Acceptance Rate
The University of Manchester does not publish an annual admissions report but does offer some insight for specific courses. For example, the Medicine faculty publishes statistics for the university’s Medicine and Dentistry degrees. In 2024, there were 2,392 applicants for Medicine, of which 1,596 were interviewed and 1,033 were given offers. This gives an offer rate of 43.2%, which is on the higher end for both a Russell Group university and a Medicine degree.
Newcastle University Acceptance Rate
2023 Entry
Applicants: 36,131
Offers: 24,642
Acceptances: 7,164
Offer Rate: 68.2%
Acceptance Rate: 19.8%
2022 Entry
Applicants: 34,388
Offers: 24,623
Acceptances: 6,605
Offer Rate: 71.6%
Acceptance Rate: 19.2%
While Newcastle University doesn’t have an annual admissions report, we thankfully have a comprehensive table of data provided by an FOI request. This data shows us that Newcastle has some of the highest offer rates in the whole of the Russell Group, with 71% of applicants being offered a place in 2022.
Despite this abnormally high offer rate, there is a large difference between the number of offers and acceptances, leading to a far more standard acceptance rate and a cohort size of around 6,500 – 7,000 each year. If Newcastle is at the top of your list of options, you’ll be pleased to see how many offers are sent out each year!
University of Nottingham Acceptance Rate
Admissions data for the University of Nottingham is very limited currently, as recent FOI requests have not provided any useful data. A request from 2020 details that the offer rate for that year was 74%, which is incredibly high. These statistics are pre-pandemic, so the admissions process has likely undergone changes since then.
As for HESA statistics, it’s stated that the university admitted around 8,930 undergraduate students in 2023 and 9,300 in 2022.
University of Oxford Acceptance Rate
2025
Applicants: 23,329
Offers: 3,891
Acceptances: 3,302
Offer Rate: 16.7%
Acceptance Rate: 14.2%
2024
Applicants: 23,061
Offers: 3,793
Acceptances: 3,245
Offer Rate: 16.4%
Acceptance Rate: 14.1%
2023
Applicants: 23,211
Offers: 3,721
Acceptances: 3,219
Offer Rate: 16.0%
Acceptance Rate: 13.9%
2022
Applicants: 23,819
Offers: 3,645
Acceptances: 3,271
Offer Rate: 15.3%
Acceptance Rate: 13.7%
The University of Oxford publishes an annual report each year, so we have extremely in-depth data on the admissions process. Beyond this, a Tableau is also available that breaks this data down even further.
Oxford has historically been slightly more competitive than Cambridge, which is proven by this data. We can also see that Oxford follows the upward trend for offer and acceptance rates that many universities experienced in 2023 and 2024, although to a much smaller degree. However, Oxford still remains one of the hardest universities to get into.
We’ve explored the acceptance rates for every undergraduate course and every college at Oxford in our two dedicated guides, so be sure to check them out if you want to know the statistics for your specific choices.

Queen Mary University of London Acceptance Rate
Queen Mary does not publish admissions data for its whole undergraduate cohort, but its Faculty of Medicine and Dentistry does release figures for Medicine (A100), Graduate Entry Medicine (A101) and Dentistry (A200). Combined across all three courses, Home and Overseas:
2026 Entry
Applicants: 4,029
Offers: 1,324
Acceptances: 445
Offer Rate: 32.9%
Acceptance Rate: 13.7%
2025 Entry
Applicants: 3,249
Offers: 1,259
Acceptances: 445
Offer Rate: 38.8%
Acceptance Rate: 13.7%
2024 Entry
Applicants: 3,722
Offers: 909
Acceptances: 442
Offer Rate: 24.4%
Acceptance Rate: 11.9%
2023 Entry
Applicants: 4,586
Offers: 856
Acceptances: 442
Offer Rate: 18.7%
Acceptance Rate: 9.6%
For 2026 entry, Queen Mary made offers to 32.9% of Medicine and Dentistry applicants, down from 38.8% in 2025 as applications rose faster than offers. Rates vary widely by course, from 57.2% for Home A100 Medicine applicants to just 7.6% for A101 Graduate Entry Medicine. Note that Queen Mary reports “places” rather than acceptances, so the second rate reflects places available per applicant rather than students enrolled.
Queen's University Belfast Acceptance Rate
There is no official data available for Queen’s University Belfast’s admissions. An acceptance rate of 35% is quoted in some places but is not backed up by an official source. HESA states that the university saw around 6,050 new undergraduates in 2023 and 6,390 in 2022.
University of Sheffield Acceptance Rate
2022 Entry
Applicants: 33,027
Offers: 25,944
Acceptances: 6,430
Offer Rate: 78.6%
Acceptance Rate: 19.5%
While no official report has been published by the University of Sheffield, an FOI request was able to provide application and offer figures for the 2022 admissions cycle.
From this data, we can see that Sheffield had an incredibly high offer rate of 78.6% for 2022 entry, around 7 percentage points higher than Newcastle University’s 71.6% that year. However, its acceptance rate was far more reasonable, at 19.5%, although the acceptances figure comes from HESA rather than the FOI request, so treat it with some caution.
University of Southampton Acceptance Rate
Unfortunately, there is no reliable data regarding the University of Southampton’s admissions publicly available. HESA states that the university had 5,010 new undergraduate students in 2023 and 5,045 in 2022.
UCL Acceptance Rate (University College London)
2025 Entry
Applicants: 89,239
Offers: 38,696
Acceptances: 9,138
Offer Rate: 43.4%
Acceptance Rate: 10.2%
2024 Entry
Applicants: 77,828
Offers: 26,253
Acceptances: 7,682
Offer Rate: 33.7%
Acceptance Rate: 9.9%
2023 Entry
Applicants: 79,082
Offers: 19,676
Acceptances: 7,001
Offer Rate: 24.9%
Acceptance Rate: 8.9%
2022 Entry
Applicants: 73,994
Offers: 21,221
Acceptances: 6,288
Offer Rate: 28.7%
Acceptance Rate: 8.5%
2021 Entry
Applicants: 58,362
Offers: 19,724
Acceptances: 6,049
Offer Rate: 33.8%
Acceptance Rate: 10.4%
UCL publishes applications, offers and places for every undergraduate department each year. For 2025 entry, it received 89,239 applications, more than any other Russell Group university with published data, and made 38,696 offers, an offer rate of 43.4%. That’s a sharp rise from 24.9% for 2023 entry, as UCL has made more offers each year and increased its number of places from 7,001 to 9,138. Note that UCL reports “places” rather than acceptances, so the second rate shows places available per applicant rather than students enrolled. You can dive into even more UCL application data in our dedicated UCL Acceptance Rate Guide.

University of Warwick Acceptance Rate
The University of Warwick offers an interactive table that provides a wide range of admissions data, dating back over a decade:
2025 Entry
Applicants: 47,702
Offers: 36,667
Acceptances: 7,398
Offer Rate: 76.9%
Acceptance Rate: 15.5%
2024 Entry
Applicants: 46,303
Offers: 32,763
Acceptances: 6,217
Offer Rate: 70.8%
Acceptance Rate: 13.4%
2023 Entry
Applicants: 48,025
Offers: 30,256
Acceptances: 6,045
Offer Rate: 63.0%
Acceptance Rate: 12.6%
2022 Entry
Applicants: 45,325
Offers: 27,506
Acceptances: 6,075
Offer Rate: 60.7%
Acceptance Rate: 13.4%
2021 Entry
Applicants: 43,328
Offers: 29,297
Acceptances: 6,244
Offer Rate: 67.6%
Acceptance Rate: 14.4%
This data shows that Warwick is generally very generous with offers, while acceptances are much lower, reaching the same levels as Oxford and Cambridge. The applicant pool is bigger each year compared to 5 years ago, but offer rates have also been going up, meaning it’s getting less difficult to get into Warwick.
University of York Acceptance Rate
Lastly, we have the University of York, which doesn’t provide in-depth admissions data to the public. However, the university does officially confirm the intake numbers for undergraduates each year.
The number of new undergraduate students has fluctuated in the last three years, with 2022 admitting 4,830 students, 2023 admitting 4,920 and 2024 admitting 5,335 (rounded to the nearest five). These numbers are fairly average for Russell Group universities, although leaning towards the lower end of the spectrum.
That brings us to the end of the data for Russell Group university admissions for undergraduates. Now that we’ve seen this, let’s answer some of the most pressing questions you may have based on the information we have available to us.
Triple your chances of Russell Group success with UniAdmissions
In 2025, we got 67% of our students into Oxford or Cambridge, more than three times higher than the national average. Even more get offers from other Russell Group universities, because our students have access to the best possible support – support that you can access too when you enrol for one of our Full-Blue Programmes.
Discover our Full-Blue Programme by clicking the button below to learn how you can enrol and triple your chances of success.
Russell Group Admissions Statistics - What Can We Learn?
The questions that many applicants will be asking about the Russell Group are “Which one is easiest to get into?” and “Which one is hardest to get into?”. Let’s use the data we have available to answer these questions!
Most Competitive Russell Group Universities
Firstly, let’s look at the universities with the most applicants and fewest available spaces (based on the available data:
Russell Group Universities with Most Applicants
Most Russell Group universities receive tens of thousands of applications, but the university with the most applications for 2025 entry was UCL, with 89,239 undergraduate applications across all of its courses. That’s the highest figure for any university in any admissions cycle featured in this guide. UCL is a very popular choice for both home and international students, and when combined with the wide variety of courses on offer, it’s no surprise to see it receive so many applications each year.
However, this does not necessarily mean it’s the most competitive university. More courses mean that the applicant pool is spread thinner, so per course you’re unlikely to be competing against many more applicants than at other universities. The course acceptance rate is generally more important than the overall university acceptance rate, as some courses can be much easier to get into than others.
In second place is King’s College London, with 71,486 applications for 2025 entry, followed by the University of Edinburgh with 68,862. Edinburgh hasn’t always trailed behind, though: in 2022, it received 74,782 applications, the most of any Russell Group university with published data that year.
Russell Group Universities with Least Offers and Acceptances
While the number of applicants is important, the amount offers that a university sends out is the figure that will most impact your chances of success, while the acceptances provide more context about what applicants do after getting their offers.
Russell Group Universities with Least Offers
Based on the available data, the university that sent out the least offers was the University of Oxford, which only sent out 3,891 offers. As the more competitive of the two Oxbridge universities, this result makes a lot of sense, especially considering how limited the course selection is compared to other Russell Group Universities.
LSE and Cambridge follow Oxford (3,891) with 4,769 and 4,947 offers, respectively. These are both very similar to Oxford, being world-famous universities with limited courses available.
Russell Group Universities with Least Acceptances
Despite sending out nearly 900 more offers than Oxford, LSE had the lowest number of admitted students of any Russell Group university with published data for 2025 entry, welcoming just 1,953 new undergraduates. While LSE’s course selection is slim, it’s still surprising that it admits so few students each year. In 2021, the figure was even lower, at just 1,740.
Imperial College London is another interesting case. For 2025 entry, it sent out more than twice as many offers as Oxford (8,143 compared with 3,891), but admitted fewer than half of its offer holders, ending up with 3,627 new students. In 2022 and 2023, Imperial actually admitted fewer students than Oxford, despite making far more offers.
Russell Group Universities with Lowest Offer and Acceptance Rates
We’ve explored the applications, offers and acceptances, but understanding the offer and acceptance rates is the most important thing to consider. These rates take all of the context into account to show exactly how likely a student was of getting their offer in a specific year.
Russell Group Universities with Lowest Offer Rate
Unsurprisingly, the university with one of the lowest offer rates was Oxford, at 16.7% in 2025. Despite having slightly fewer applicants than the average Russell Group university, the selective nature of Oxford’s admissions process led to it having one of the lowest offer totals and offer rates, indicating that it is one of the most competitive Russell Group university.
Two other highly competitive universities are LSE (16.1%) and Cambridge (21.7%). Cambridge is often considered to be as difficult to get into as Oxford, but it commonly has a higher offer and acceptance rate, so it’s not surprising to see this result. What is surprising is that LSE was actually more competitive by over 5%. LSE isn’t as common to see when discussing the most competitive universities, but the university actually had over 5,000 more applicants than Cambridge and gave out roughly the same number of offers.
Russell Group Universities with Lowest Acceptance Rate
While LSE wasn’t quite the most competitive university of offers, it was definitely the most difficult to ultimately get into, with an acceptance rate of just 7.7%. We already know that it admitted the least amount of students, but a drop of 10% between the offer and acceptance rate is fairly big (although far from the biggest for a Russell Group university).
Two other universities have acceptance rates in the single digits for 2023: UCL (8.5%) and Edinburgh (9.2%). These are both universities that gave out a lot of offers but ended up admitting far fewer students, but why is this?
In some cases, it will be due to applicants not meeting the grade requirements, but not every course at these universities has high entry requirements. Remember that all UK university applicants have the option to apply to up to five universities, so getting an offer from. university doesn’t mean you have to attend.
Many ambitious applicants will apply to Oxford or Cambridge, but they will still select other universities – like UCL and Edinburgh – as insurance choices. Applicants who get an offer from Oxford or Cambridge are likely going to get offers from their other choices too, but In a case where an applicant has the choice to study at Oxbridge or another university, most will go with Oxbridge. This leads to a reduction in the acceptance rates for the other universities.
Of course, this isn’t exclusive to Oxbridge as an applicant could choose any university they want over their other offers. Applicants only get one choice, so it’s far more common to see a large divide between the offer and acceptance rates for a university; Oxbridge is just the exception to this.
This data confirms that the most competitive Russell Group universities are Oxford, Cambridge and LSE, although many of the other top-tier universities are still very competitive. However, let’s now look at the inverse of this and see which Russell Group universities are easiest to get into:
Least Competitive Russell Group Universities
To find the least competitive Russell Group universities, we simply need to look at the opposites of everything we explored to find the most competitive universities:
Russell Group Universities with Least Applicants
Looking at the number of applicants a university has is the least effective way to determine competitiveness, as it doesn’t take into account how many offers and places are actually available.
This is evidenced by the fact that, for both 2022 and 2023, the two Russell Group universities with the least applicants were Oxford and Cambridge, two of the most competitive universities in the world.
The applicant numbers are low here for a number of reasons, including the daunting reputation, in-depth application process and high entry requirements. Plus, UCAS does not allow applicants to apply to both Oxford and Cambridge in the same year, so that further restricts how many applicants each university can receive.
Russell Group Universities with Most Offers and Acceptances
When thinking about universities that are easy to get into, the first thing that will come to mind is the universities that give out the most offers and accept the most students. Let’s find out which ones they were:
Russell Group Universities with Most Offers
For 2025 entry, the Russell Group university that sent the most offers was UCL, which made 38,696 offers from 89,239 applications. UCL also received more applications than any other Russell Group university with published data, so it’s no surprise to see it at the top of this list too.
Following UCL are Warwick and Edinburgh, which sent 36,667 and 36,195 offers respectively, with King’s College London close behind on 32,277. Warwick’s position is especially notable, as it received far fewer applications than the others (47,702), meaning it made offers to 76.9% of its applicants. The common factor between all of these universities is that they offer a wide variety of courses rather than specialising in a few subject areas, so they have far more places to fill and more offers to send out.
Russell Group Universities with Most Acceptances
When it comes to acceptances, we can review the data provided by HESA to see which universities had the more new undergraduates. In both 2022 and 2023, the top university for admissions was Manchester. In 2022, Manchester was the only university to admit over 10,000 students, while 2023 saw 9,315 new undergraduates.
The other biggest universities for acceptances in 2023 were Nottingham and Cardiff, each admitting over 8,700 students. However, while this data may be accurate, it is not verified by an official university source. Based on the official data we have, the university with the most acceptances was King’s College London, which admitted 7,710 students out of the 29,000 _ offer holders.
Russell Group Universities with Highest Offer and Acceptance Rates
Now it’s time to review the universities with the top success rates for applicants to determine which ones are actually the least competitive.
Russell Group Universities with Highest Offer Rate
For 2025 entry, the highest offer rates among Russell Group universities with published data were at Durham and Warwick, which each made offers to 76.9% of applicants (27,005 offers from 35,130 applications at Durham, and 36,667 from 47,702 at Warwick). Edinburgh followed at 52.6%. Older data shows similarly high rates elsewhere: Newcastle made offers to 68.2% of applicants for 2023 entry, and Sheffield to 78.6% for 2022 entry.
Glasgow is also worth mentioning. A University of Glasgow presentation gives a 65% offer rate for home applicants for 2023 entry, though the full applicant and offer figures haven’t been published. Unlike the other rates in this section, that figure covers home applicants only, and offer rates can differ noticeably by fee status, so it isn’t directly comparable. The most recent whole-cohort figure for Glasgow, from a Freedom of Information request, is 58.3% for 2022 entry (24,994 offers from 42,901 applications).
Russell Group Universities with Highest Acceptance Rate
When it comes to acceptance rates, we can see that the figures get much lower, with no Russell Group university having an acceptance rate over 20%. However, we’ve already discussed why this doesn’t mean universities are more or less competitive, as getting an offer is the hardest part of the process.
For 2025 entry, the highest acceptance rate among Russell Group universities with published data was Cambridge, at 16.3%, followed by Warwick (15.5%) and Oxford (14.2%). Older figures were higher still: Newcastle admitted 19.8% of its applicants for 2023 entry and Sheffield 19.5% for 2022 entry, but neither has published more recent data. The appearance of Cambridge and Oxford at the top of this list shows that acceptance rates are far less useful than offer rates for judging how competitive a university is.
Remember that we do not have data for every university in the Russell Group, so some of the other universities in the group may have higher or lower statistics than the ones we’ve mentioned above.
Based on the latest data for 2025 entry, the most competitive Russell Group university with published figures was LSE, which had both the lowest offer rate (16.1%) and the lowest acceptance rate (6.6%). Oxford was close behind with an offer rate of 16.7%. At the other end of the scale, Durham and Warwick had the highest offer rates, each making offers to 76.9% of applicants.
While this may influence your decision-making process, it shouldn’t be the factor that makes you choose a specific university or not apply to another one. It’s not impossible to get an offer from any university, nor is a place ever guaranteed, no matter how high the offer rates are. Choose the universities that you feel comfortable applying to and the ones you actually want to study at.
That concludes our look at Russell Group acceptance rates. We hope this information has been helpful to you in understanding the current landscape for university admissions and how hard it is to get into certain places. While it’s important to apply to universities that appeal to you, it’s also crucial that you can realistically succeed in your application.
Oxbridge and Imperial aren’t for everyone, so review the admissions statistics alongside entry requirements for your course to consider how likely you are to get a place. If you’re confident in your grades and your drive to learn, then apply for your favourite universities and you may have a good chance of getting in!
Of course, hard work is going to be essential for getting your place in one of the UK’s top universities, but you may feel that you need extra support to boost your application and give yourself the best chance of success. UniAdmissions have specialised in getting students in Oxbridge for over a decade, so our Full-Blue Programmes may be exactly what you need to refine your application and get your offer.
Oxford and Cambridge both have very low offer rates, but we get 67% of our students an offer to study at either university on average. We have achieved this through years of work creating the perfect preparation curriculum, which includes one-to-one tuition, intensive courses and hundreds of resources, all available in our virtual portal. We have limited slots available so you can book a free consultation with our admissions team today to learn more about the enrolment process!
Less than 16% of Oxbridge applicants got their place, but 67% of UniAdmissions students got their Oxbridge offer.
If you want the best chance of getting into Oxbridge, as well as other Russell Group universities, enrol on a Full-Blue Programme to receive world-class application support from start to finish. Our students have access to expert resources, one-to-one tuition sessions, intensive courses and much more, all designed to give them the best possible chance of success.
Discover our Full-Blue Programme by clicking the button below to learn how you can enrol and triple your chances of success.
Frequently Asked Questions
Not at all. Newcastle has one of the highest offer rates in the Russell Group at around 68%, yet consistently ranks among the top 30 universities in the UK and is highly regarded for subjects like Medicine, Law and Architecture. Offer rates can also reflect how many places a university has available relative to its applicants, not the quality of education or the value of the degree. Durham and Warwick both have offer rates above 60% and sit comfortably in the top 10 for many subjects.
LSE admits a very small number of undergraduates each year: just 1,953 for 2025 entry, from 29,653 applications. Its narrow focus on economics, finance, law and the social sciences means it has far fewer places than broader universities. For 2025 entry, LSE’s offer rate of 16.1% was lower than Oxford’s 16.7%, but the bigger difference comes after offers are made. Only around 41% of LSE’s offer holders went on to enrol, compared with about 85% at Oxford. As a result, LSE’s acceptance rate was 6.6%, less than half of Oxford’s 14.2%.
No, and the variation in transparency is noticeable. Oxford, Cambridge, Imperial, UCL, LSE, Warwick and Edinburgh all publish comprehensive annual reports. Others release very little, meaning publicly available figures for those universities often come from unverified third-party sources or HESA estimates.
Most do, yes. They take into account factors such as school type, postcode, eligibility for free school meals, and personal circumstances. In practice, this can mean a slightly lower grade offer for eligible applicants. If you are applying from a state school background or a disadvantaged area, it is worth checking each university's contextual admissions policy directly, as the criteria and benefits differ meaningfully between institutions.

