

5 things to know
Key Takeaways
- The TMUA is scored from 1.0 to 9.0, reported to one decimal place, as a single overall score covering both papers. All 40 questions are worth the same, there's no negative marking, and UAT-UK designs the scale so that a typical candidate scores around 4.5.
- There are no TMUA grade boundaries and no pass mark. UAT-UK, which has run the test since 2024, adjusts scores for how difficult each question was, so it doesn't publish a raw-mark conversion table. The conversion tables you'll find online only cover sittings up to 2023.
- Across the October 2025 and January 2026 sittings, the most common TMUA score was 3.5, achieved by about 13.5% of candidates, and the median was roughly 4.0. October candidates did better on their own: their most common score was 4.5.
- A good TMUA score is 6.5 or above. In 2025/26, only about 13% of candidates reached 6.5, around 9% scored 7.0 or higher, and about 2.5% got the maximum 9.0.
- Offer holders score well above the average. Cambridge's TMUA offer holders averaged 6.31 in its 2025 apply year, compared with 4.56 for all its TMUA applicants, and Imperial's Mathematics offer holders averaged 7.6 for 2025 entry. Your score still isn't everything, though: LSE made an Economics offer to an applicant who scored 3.9.
The TMUA is part of the application process for a number of different courses at the universities of Cambridge and (as of 2026) Oxford, such as Maths, Economics and Computer Science and other Russell Group university courses, such as Warwick Maths.
If you are due to sit the TMUA, you might be wondering how the Admissions test is scored and how your results will be presented to you.
This is why we have put together this guide, going over everything you need to know about the scoring and results of the TMUA.
TMUA Results 2025/2026
The TMUA Results for the January 2026 sittings were released on February 11th, 2026. You can view both the October 2025 and the distributed 2025/26 TMUA results here:
What makes the TMUA scoring so different?
Throughout your schooling so far, the exams you have sat have most likely been scored as a percentage with the aim of getting as close to 100% as you can.
The scoring of the TMUA does not follow this method, and this guide will help you decipher how this works and how to interpret your results.
The World’s First Oxbridge Preparatory School
Welcome to UniAdmissions, the world’s first Oxbridge preparatory school with an Oxbridge success rate of 67% and with over 1,214 UniAdmissions students placed at Oxford and Cambridge since 2013.
Performing well in the TMUA is crucial for your application. Our TMUA support prepares you to score highly through one-to-one tuition sessions, intensive courses, and more. Click the button below to discover our TMUA support.
TMUA Results
TMUA Results 2025/2026
The results for both the 2025 October and 2026 January sittings of the TMUA were released, so let’s review how the cohort did with the test in its new computer-based format.
TMUA Score Distribution 2025/26
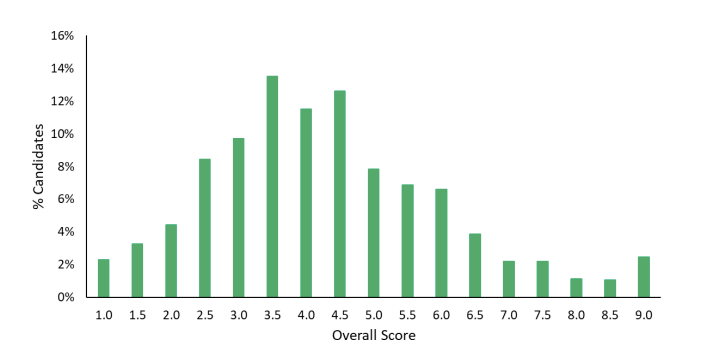
Although the TMUA is split into two separate papers, UAT-UK (the exam organiser behind the TMUA) has only published the overall scores for each applicant. This chart displays what percentage of the cohort achieved each score from 1.0 – 9.0 (rounded to the nearest .5).
The chart shows that the most common score for both the October 2025 and January 2026 sittings was 3.5, with almost 14% of applicants achieving this mark. This is lower than the 2024/25 modal score of 4.0. Although UAT-UK states that the scale is designed so that typical candidates score around 4.5, the data from the past two years suggests this has not been reflected in practice. The second most common score was 4.5, achieved by approximately 12.5% of applicants. Most candidates scored between 2.5 and 5.5, indicating that a score above 5.5-6.0 would likely be considered competitive.
The data presented above, published in January 2026, combines results from both TMUA sittings. When compared with the October 2025 results alone, a similar overall pattern emerges. In October, the most common grade was 4.5, achieved by over 14% of applicants, followed by 3.5 at just over 12%. However, in the combined data, 3.5 becomes the modal score. This suggests that a greater proportion of candidates scored toward the lower end of the mid-range distribution — and a smaller proportion toward the upper end — in the January sitting compared with October.
TMUA Results 2025 - October's Sitting
The TMUA results for the October 2025 sitting were released to students on Friday 14th November 2025.
TMUA Score Distribution October 2025
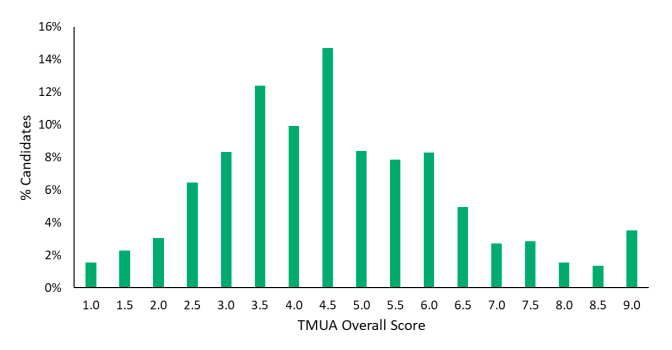
As you can see, the most common score for this sitting was 4.5 (over 14%), closely followed by 3.5 (over 12%).
Compared with October 2024, the distribution is less balanced around the mid-range grades. This year, more students are receiving lower grades such as 3.5, while fewer are achieving higher grades like 5 and 5.5. At the extremes of the grade range, there are no significant changes; however, the shift within the mid-range has caused a small change in the overall average score.
When we include the results from January of this year, the comparison remains largely unchanged. The main difference is that a much greater proportion of applicants scored 4.0 in January, whereas this time a significantly higher number achieved 4.5.
TMUA Results 2024/2025
The results for both the 2024 October and 2025 January sittings of the TMUA were released, so let’s review how the cohort did with the test in its new computer-based format.
TMUA Score Distribution 2024/25
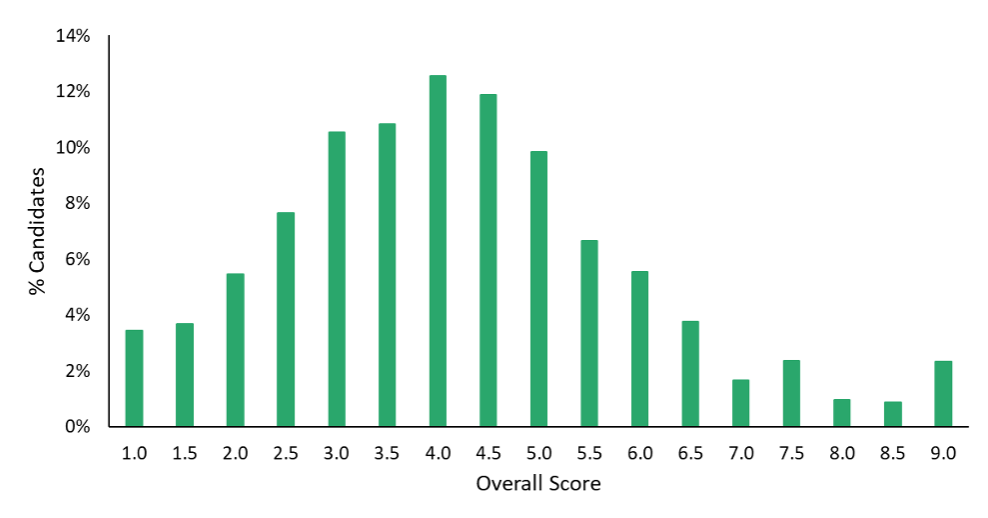
Although the TMUA is split into two separate papers, UAT-UK (the exam organiser behind the TMUA) has only published the overall scores for each applicant. This chart displays what percentage of the cohort achieved each score from 1.0 – 9.0 (rounded to the nearest .5).
Firstly, it’s important to understand that due to the score conversion process for the test, scores of 1.0 and 9.0 encompass a range of different raw marks. Each subtest has a defined cut-off beyond which the score cannot increase or decrease, meaning that multiple candidates may receive these scores despite achieving different raw totals at the extreme upper or lower ends of the scale.
From this chart, we can see that the most common score was 4.0, with roughly 12% of applicants achieving it. The majority of applicants scored between 3.0 and 5.0 (around 50%), meaning a score in this range would be fairly average and won’t help you stand out in the application process. Interestingly, UAT claims that the test was designed for the typical applicant to score 4.5, but this data shows that this wasn’t the case (although 4.5 was the second most common score).
The chart seen above was published in February 2025 and combines the results from both sittings of the TMUA. However, the results from the October 2024 sitting were previously published in November 2024. The chart can be seen below:
TMUA Score Distribution October 2024
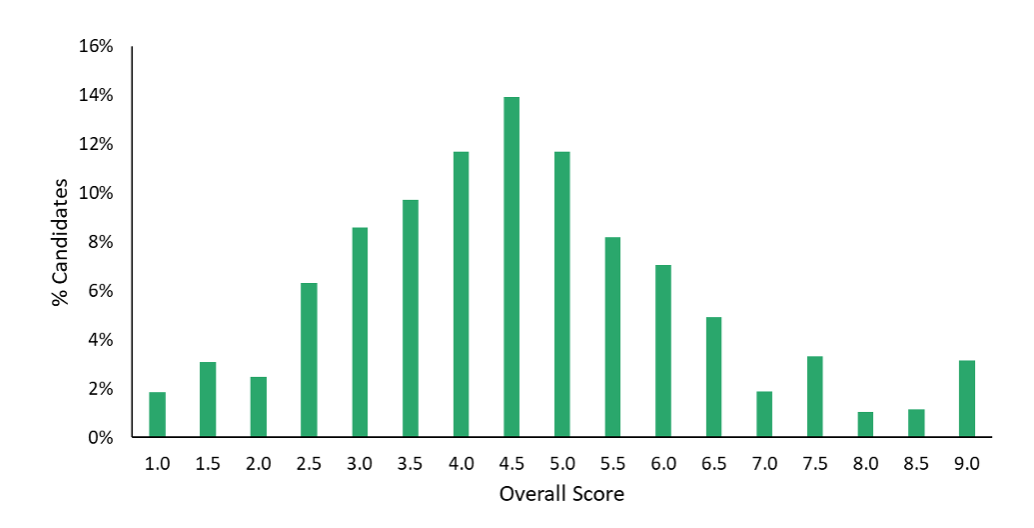
From this chart, we can see that the most common score was 4.5, an increase of 0.5 points compared to the results from both sittings. Overall, the graphs show the same general shape, with only a handful of differences. From this, we can assume that both papers were of near equal difficulty (although the first test may have been slightly easier).
We suggest that a good score to aim for in the TMUA is 6.5+. As we can see, only around 15% of test takers got a score in this range, with 3% scoring 9.0. If you’re able to score in this range, you’ll have a very good chance of getting an interview.
Below is a complete comparison view for the periods between October 2024 and February 2026 which shows what percentage of applicants achieved what score.
| TMUA Score | 2025/26, both sittings (%) | October 2025 (%) | 2024/25, both sittings (%) | October 2024 (%) |
|---|---|---|---|---|
| 1 | 2.3 | 1.5 | 3.4 | 1.9 |
| 1.5 | 3.2 | 2.3 | 3.7 | 3.1 |
| 2.0 | 4.4 | 3.0 | 5.5 | 2.5 |
| 2.5 | 8.4 | 6.4 | 7.7 | 6.3 |
| 3.0 | 9.7 | 8.3 | 10.6 | 8.6 |
| 3.5 | 13.5 | 12.4 | 10.8 | 9.7 |
| 4.0 | 11.5 | 9.9 | 12.6 | 11.7 |
| 4.5 | 12.6 | 14.7 | 11.9 | 13.9 |
| 5.0 | 7.8 | 8.3 | 9.8 | 11.7 |
| 5.5 | 6.9 | 7.8 | 6.7 | 8.2 |
| 6.0 | 6.6 | 8.3 | 5.5 | 7.1 |
| 6.5 | 3.9 | 4.9 | 3.7 | 4.9 |
| 7.0 | 2.1 | 2.7 | 1.7 | 1.9 |
| 7.5 | 2.1 | 2.8 | 2.3 | 3.3 |
| 8.0 | 1.1 | 1.5 | 1.0 | 1.0 |
| 8.5 | 1.0 | 1.3 | 0.9 | 1.2 |
| 9.0 | 2.5 | 3.5 | 2.3 | 3.1 |
TMUA Scoring Percentiles 2024-2026
| Percentile | 2025/26, both sittings | October 2025 | 2024/25, both sittings | October 2024 |
|---|---|---|---|---|
| 25th (top 75%) | 3.0 | 3.5 | 3.0 | 3.5 |
| 50th (median) | 4.0 | 4.5 | 4.0 | 4.5 |
| 75th (top 25%) | 5.5 | 6.0 | 5.0 | 5.5 |
| 90th (top 10%) | 6.5 | 7.0 | 6.5 | 7.0 |
UAT-UK doesn’t publish percentiles, so we’ve calculated them from its published score distributions. Because scores are grouped to the nearest 0.5, treat these as estimates. In 2025/26, a score of 6.5 put you in roughly the top 13% of candidates across both sittings, and a 5.5 put you in roughly the top quarter. October candidates have scored higher than January candidates in both years so far, which is why the October-only columns are higher.
When do you get your TMUA results?
Firstly, you will likely be wondering when you will actually get your results. UAT-UK states that scores will be sent to students roughly 4 weeks after the test dates.
That means that applicants who sit the TMUA in October will receive their results towards the end of November, while those who sit the January sitting will receive theirs in mid-February. Your final score will be viewable in your UAT-UK account dashboard, so be sure to check this on the release day.
You will not need to do anything before or after receiving your results, as your results will be passed directly to the university/college that you have applied to.
How is the TMUA Scored?
The TMUA is split into two sections, each with 20 questions. Each of these 40 questions is worth the same amount in the scoring of the test, and there is no negative marking.
Your TMUA result is presented as a score ranging from 1.0 (lowest) to 9.0 (highest), with typical candidates scoring around 4.0. Approximately 10% of applicants score above 7.0, and low scores are capped at 1.0.
Your final score is based on your overall performance across both papers. While applicants were previously given separate scores for each paper, TMUA results are now reported as a single overall score for the whole test.
To produce this reported score, raw marks are scaled using a conversion process that varies by year and sitting. These conversion methods are not published for current sittings.
TMUA Historical Score Conversions (2020-2023)
These score conversion tables relate to previous TMUA sittings where scores were reported per paper. TMUA scoring has since changed to a single overall score, and score conversions vary year to year. As a result, these tables are provided for historical reference only and are not representative of future score conversions.
2020
| Paper 1 Raw Score | Paper 1 Reported Grade | Paper 2 Raw Score | Paper 2 Reported Grade |
|---|---|---|---|
| 20 | 9 | 20 | 9 |
| 19 | 8.9 | 19 | 9 |
| 18 | 8.2 | 18 | 8.4 |
| 17 | 7.8 | 17 | 7.9 |
| 16 | 7.4 | 16 | 7.6 |
| 15 | 7.1 | 15 | 7.3 |
| 14 | 6.9 | 14 | 7 |
| 13 | 6.7 | 13 | 6.8 |
| 12 | 6.4 | 12 | 6.5 |
| 11 | 5.8 | 11 | 6 |
| 10 | 5.3 | 10 | 5.4 |
| 9 | 4.7 | 9 | 4.8 |
| 8 | 4.2 | 8 | 4.2 |
| 7 | 3.6 | 7 | 3.6 |
| 6 | 3 | 6 | 2.9 |
| 5 | 2.3 | 5 | 2.2 |
| 4 | 1.6 | 4 | 1.3 |
| 3 | 1 | 3 | 1 |
| 2 | 1 | 2 | 1 |
| 1 | 1 | 1 | 1 |
| 0 | 1 | 0 | 1 |
2021
| Paper 1 Raw Score | Paper 1 Reported Grade | Paper 2 Raw Score | Paper 2 Reported Grade |
|---|---|---|---|
| 20 | 9 | 20 | 9 |
| 19 | 9 | 19 | 9 |
| 18 | 8.3 | 18 | 8.3 |
| 17 | 7.9 | 17 | 7.8 |
| 16 | 7.6 | 16 | 7.5 |
| 15 | 7.3 | 15 | 7.2 |
| 14 | 7 | 14 | 6.9 |
| 13 | 6.8 | 13 | 6.7 |
| 12 | 6.6 | 12 | 6.3 |
| 11 | 6.1 | 11 | 5.7 |
| 10 | 5.6 | 10 | 5.1 |
| 9 | 5 | 9 | 4.5 |
| 8 | 4.5 | 8 | 3.9 |
| 7 | 3.9 | 7 | 3.3 |
| 6 | 3.3 | 6 | 2.7 |
| 5 | 2.6 | 5 | 1.9 |
| 4 | 1.9 | 4 | 1.1 |
| 3 | 1 | 3 | 1 |
| 2 | 1 | 2 | 1 |
| 1 | 1 | 1 | 1 |
| 0 | 1 | 0 | 1 |
2022
| Paper 1 Raw Score | Paper 1 Reported Grade | Paper 2 Raw Score | Paper 2 Reported Grade |
|---|---|---|---|
| 20 | 9 | 20 | 9 |
| 19 | 9 | 19 | 8.9 |
| 18 | 8.5 | 18 | 8.2 |
| 17 | 8.1 | 17 | 7.8 |
| 16 | 7.8 | 16 | 7.4 |
| 15 | 7.5 | 15 | 7.2 |
| 14 | 7.3 | 14 | 6.9 |
| 13 | 7.1 | 13 | 6.7 |
| 12 | 6.9 | 12 | 6.4 |
| 11 | 6.7 | 11 | 5.8 |
| 10 | 6.5 | 10 | 5.2 |
| 9 | 6.1 | 9 | 4.6 |
| 8 | 5.6 | 8 | 4 |
| 7 | 5 | 7 | 3.4 |
| 6 | 4.4 | 6 | 2.8 |
| 5 | 3.8 | 5 | 2.1 |
| 4 | 3 | 4 | 1.3 |
| 3 | 2.1 | 3 | 1 |
| 2 | 1 | 2 | 1 |
| 1 | 1 | 1 | 1 |
| 0 | 1 | 0 | 1 |
2023
| Paper 1 Raw Score | Paper 1 Reported Grade | Paper 2 Raw Score | Paper 2 Reported Grade |
|---|---|---|---|
| 20 | 9 | 20 | 9 |
| 19 | 9 | 19 | 9 |
| 18 | 8.3 | 18 | 8.4 |
| 17 | 7.9 | 17 | 8 |
| 16 | 7.6 | 16 | 7.7 |
| 15 | 7.3 | 15 | 7.4 |
| 14 | 7.1 | 14 | 7.2 |
| 13 | 6.9 | 13 | 7 |
| 12 | 6.6 | 12 | 6.7 |
| 11 | 6.3 | 11 | 6.5 |
| 10 | 5.8 | 10 | 6.1 |
| 9 | 5.2 | 9 | 5.6 |
| 8 | 4.6 | 8 | 5 |
| 7 | 4 | 7 | 4.4 |
| 6 | 3.4 | 6 | 3.7 |
| 5 | 2.7 | 5 | 3 |
| 4 | 1.9 | 4 | 2.2 |
| 3 | 1 | 3 | 1.2 |
| 2 | 1 | 2 | 1 |
| 1 | 1 | 1 | 1 |
| 0 | 1 | 0 | 1 |
| Paper 1 Raw Score | Paper 1 Reported Score |
|---|---|
| 20 | 9.0 |
| 19 | 9.0 |
| 18 | 8.3 |
| 17 | 7.9 |
| 16 | 7.6 |
| 15 | 7.3 |
| 14 | 7.0 |
| 13 | 6.8 |
| 12 | 6.6 |
| 11 | 6.1 |
| 10 | 5.6 |
| 9 | 5.0 |
| 8 | 4.5 |
| 7 | 3.9 |
| 6 | 3.3 |
| 5 | 2.6 |
| 4 | 1.9 |
| 3 | 1.0 |
| 2 | 1.0 |
| 1 | 1.0 |
| 0 | 1.0 |
Paper 2
| Paper 2 Raw Score | Paper 2 Reported Score |
|---|---|
| 20 | 9.0 |
| 19 | 9.0 |
| 18 | 8.3 |
| 17 | 7.8 |
| 16 | 7.5 |
| 15 | 7.2 |
| 14 | 6.9 |
| 13 | 6.7 |
| 12 | 6.3 |
| 11 | 5.7 |
| 10 | 5.1 |
| 9 | 4.5 |
| 8 | 3.9 |
| 7 | 3.3 |
| 6 | 2.7 |
| 5 | 1.9 |
| 4 | 1.1 |
| 3 | 1.0 |
| 2 | 1.0 |
| 1 | 1.0 |
| 0 | 1.0 |
Overall
| Overall Raw Score | Overall Reported Score |
|---|---|
| 40 | 9.0 |
| 39 | 9.0 |
| 38 | 9.0 |
| 37 | 8.6 |
| 36 | 8.3 |
| 35 | 8.1 |
| 34 | 7.9 |
| 33 | 7.7 |
| 32 | 7.5 |
| 31 | 7.4 |
| 30 | 7.2 |
| 29 | 7.1 |
| 28 | 7.0 |
| 27 | 6.8 |
| 25 | 6.6 |
| 24 | 6.5 |
| 23 | 6.2 |
| 22 | 5.9 |
| 21 | 5.6 |
| 20 | 5.4 |
| 19 | 5.1 |
| 18 | 4.8 |
| 17 | 4.5 |
| 16 | 4.2 |
| 15 | 3.9 |
| 14 | 3.6 |
| 13 | 3.3 |
| 12 | 3.0 |
| 11 | 2.6 |
| 10 | 2.3 |
| 9 | 1.9 |
| 8 | 1.5 |
| 7 | 1.1 |
| 6 | 1.0 |
| 5 | 1.0 |
| 4 | 1.0 |
| 3 | 1.0 |
| 2 | 1.0 |
| 1 | 1.0 |
| 0 | 1.0 |
TMUA Grade Boundaries
There are no TMUA grade boundaries, and there is no pass mark. UAT-UK, which has run the test since 2024, says so directly on its results page.
The reason is the way the test is now marked. Since the TMUA moved to a computer-based test in October 2024, your score has been calculated with a statistical model (the Rasch model) that takes account of how difficult each question was. Two candidates with the same number of correct answers can end up with slightly different scores if they answered questions of different difficulty, and each sitting uses different questions. That means there is no fixed table that turns a raw mark into a 1.0 to 9.0 score, so UAT-UK doesn’t publish one.
Your result is also a single overall score. Papers 1 and 2 are no longer scored separately.
What you can do is see how your score compares with everyone else’s. The results tables further down this page show what percentage of candidates achieved each score, and the percentile table shows roughly where a given score places you in the cohort.
Before 2024, when the TMUA was run by Cambridge Assessment Admissions Testing, raw marks were converted using published conversion tables, one per paper per year. We’ve kept those below for reference. Use them to get a feel for how scaling used to work, not to predict a current score: the scoring method has changed, so they don’t apply to tests sat from October 2024 onwards.
Worried About the TMUA? Let The Big Book of Oxbridge Applications Be Your Guide
The TMUA can feel like a big unknown, from how it fits into admissions decisions to what effective preparation actually looks like. If you’re unsure where to start or how to make the most of your study time, you’re not alone.
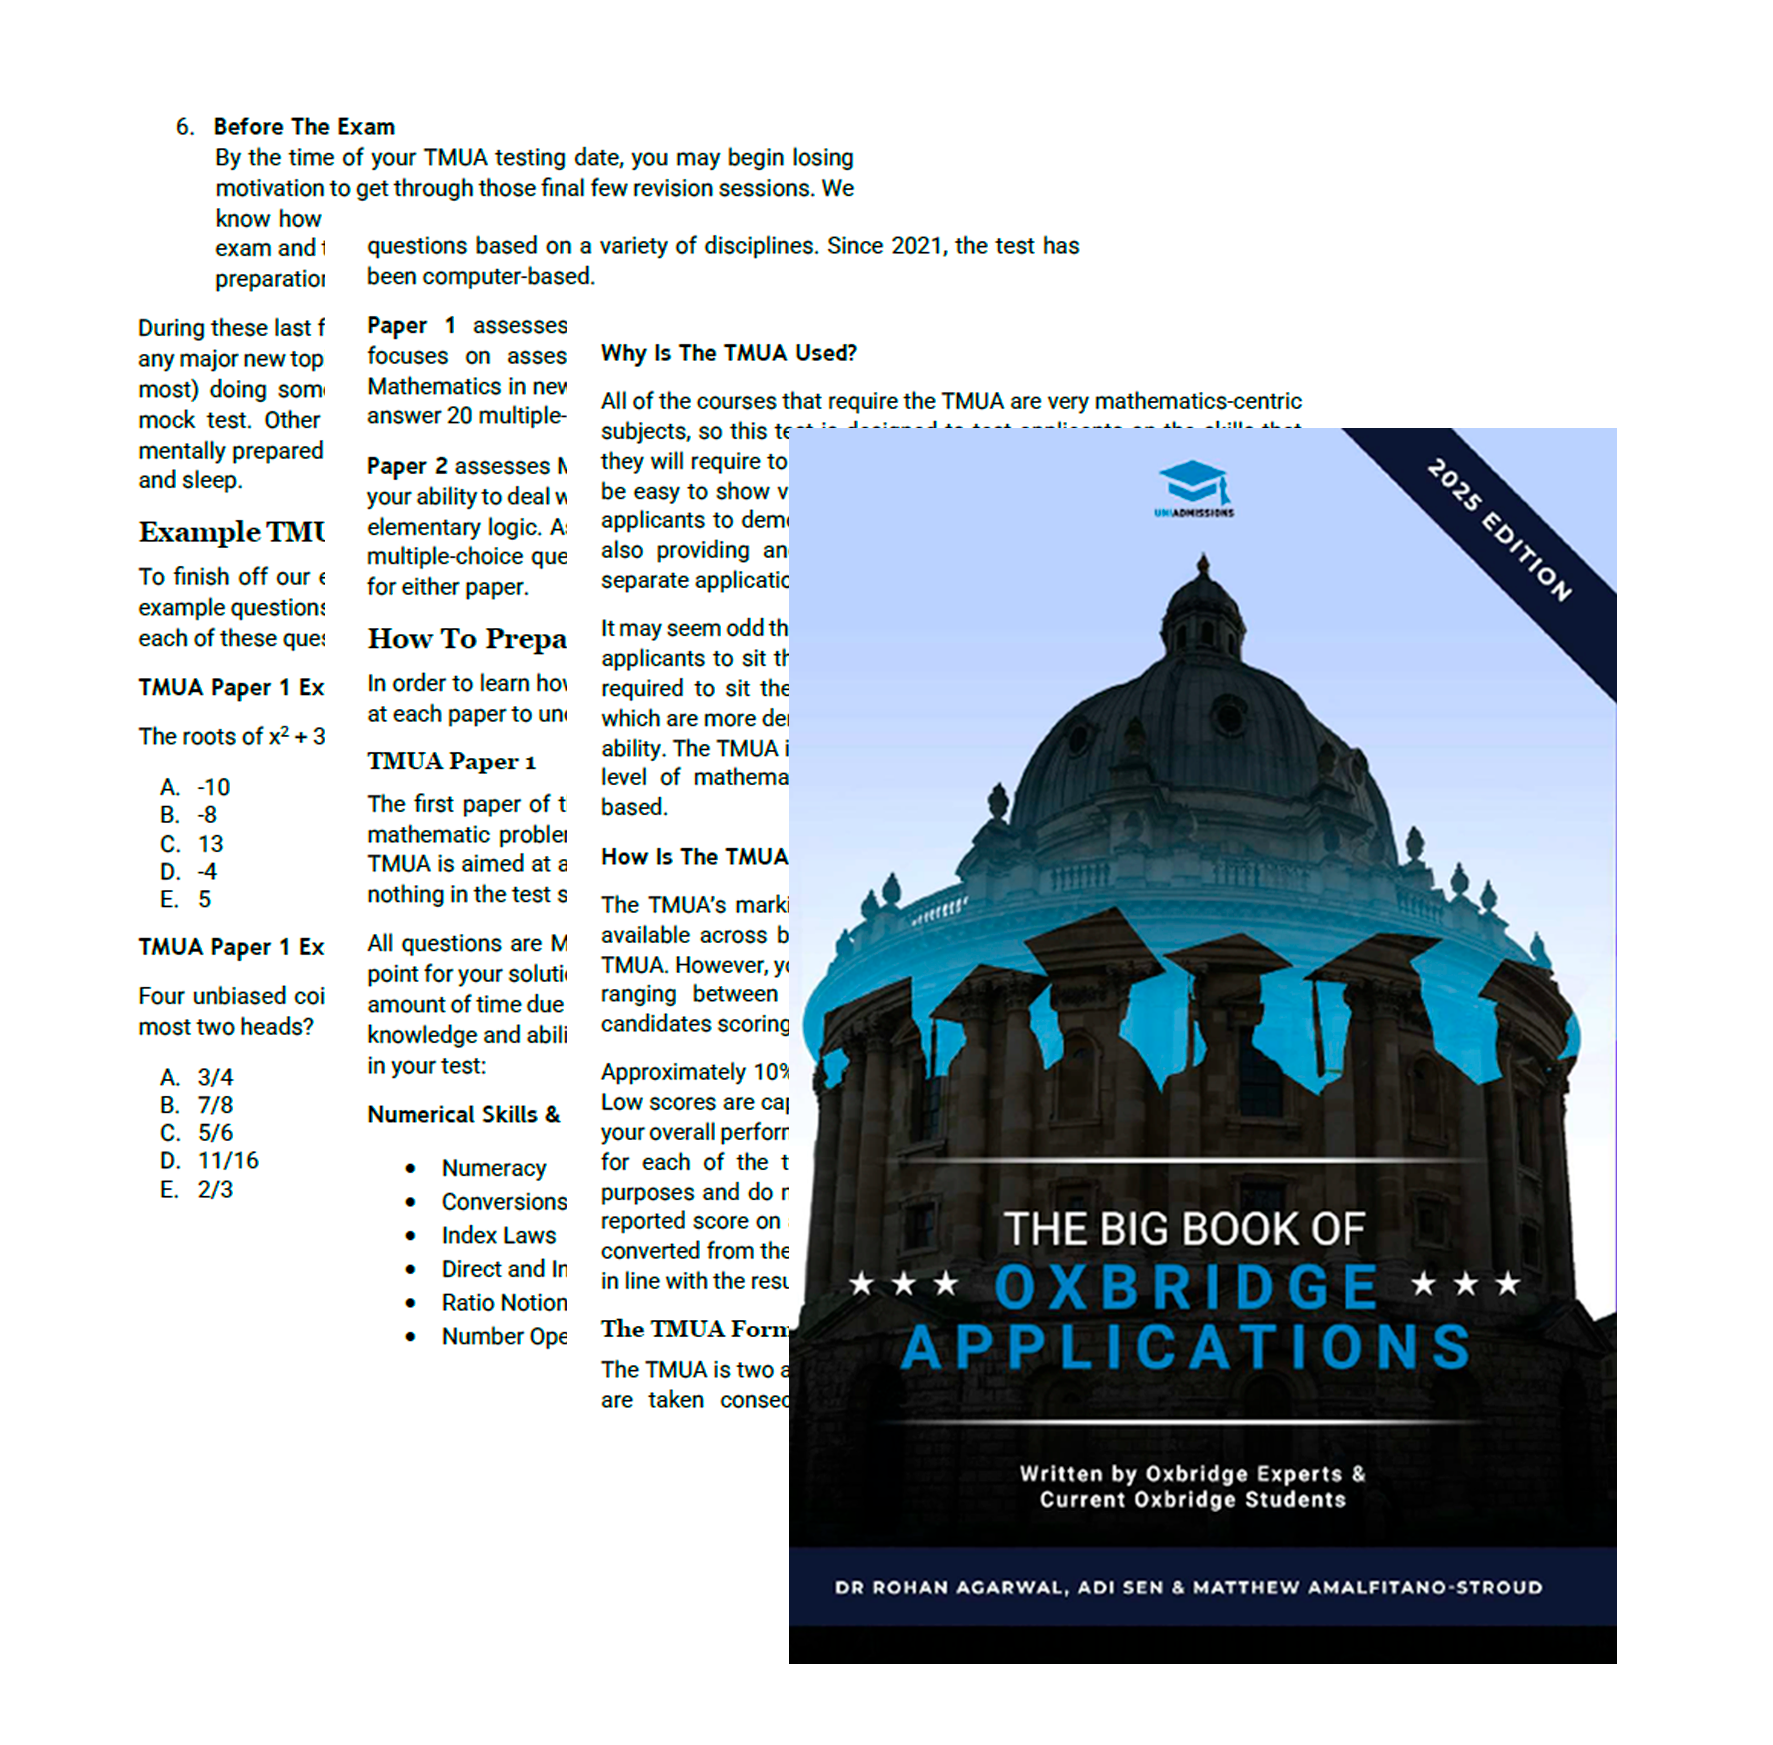
The Big Book of Oxbridge Applications takes the guesswork out of TMUA prep. The TMUA section of this free book gives you everything you need to understand the test and approach it with confidence. Inside, you’ll find:
- A clear breakdown of what the TMUA involves
- Up-to-date information on test dates and format
- Targeted preparation strategies to help you study efficiently
- Practice questions that reflect the real test
- With free TMUA past papers to download
What Can we learn from past TMUA Scores?
Although the TMUA is now run by a different examining body, the previous one had kept records of previous TMUA results.
This means, if you so wish, you can take a more thorough and detailed look at the results to see how previous years have shaped up.
Do remember that this is based on the performance of that year and the difficulty of the paper so every year will be different.
The distribution of scores (seen below) is used to clearly show candidates just how similarly matched applicants are. The scale has been designed so that approximately one-third of candidates will achieve overall scores higher than 6.5.
The most exceptional applicants will achieve a 7.0+. With this in mind, we can take a look at the 2021 TMUA results.
TMUA Paper 1 2021 Results
Below you can see the score distributions for Section 1 of the TMUA
This is a fairly standard representation of a scoring distribution, with the scores rising to a peak before going down.
The scores peak at 5.0 with around ~11% of candidates achieving this score.
Do make sure to remember that this table is purely for informational purposes and is not part of your formal test result.

TMUA Paper 2 2021 Results
As with Paper 1, this table is a fairly typical representation of the scoring distribution.
The scores peak a little higher than in Paper 1 with ~10% of candidates scoring a 5.1.
We can also see that ~15% of applicants have achieved above 7.0.
As mentioned with Paper 1, remember that this forms no part of your formal results and is just purely informational.

TMUA 2021 Overall Results
As already mentioned, this is the distribution that really matters and is that which is actually your results.
We know that the results are done how they are so that one-third of applicants score a 6.5 or above, and we can see that that is roughly the case here.
The dip in results at 5.1 is interesting to note with 4.0% of applicants achieving this before the scores peak again.

what are good, average, and low TMUA scores?
The distribution tables above provide an idea of what scores candidates have achieved, with a brief explanation of the tables themselves. But what actually is a good, average, or low score?
Based on what we have seen for the previous year’s results and the information provided by CAAT, we can see a pattern in regard to the scores. These can be categorised as follows:
What is a Good TMUA Score?
It is generally agreed that anything from 6.5 and above is considered a good TMUA score. Only the most exceptional applicant will achieve beyond this. As you can see in the distribution charts above, around this mark is where there is a drop-off in the results. By achieving a 6.5 or higher, you will be placing yourself in a very competitive position with your Cambridge application.
What is an Average TMUA Score?
For the average TMUA score, you would be looking at anything between 4.0 and 6.5; the vast majority of applicants will find themselves in this category. Falling into this range means that your TMUA score is not likely to make you stand out against candidates with similar credentials, so you must ensure the three other aspects of your application are as strong as possible.
What is a Low TMUA Score?
Anything below a 4.0, therefore, is considered a low TMUA score. Do not feel disheartened by getting this score, as it is not a failure. Remember your performance will be weighed against your fellow cohort, so there is always a chance of still getting an Interview – just make sure you ace it!
Offer-holder TMUA Scores By University
| University and course | Entry cycle | Measure | Offer holders score | All applicants score |
|---|---|---|---|---|
| Cambridge, all TMUA courses | 2025 apply year | Mean | 6.31 | 4.56 |
| Imperial Mathematics | 2025 entry | Mean | 7.6 | 4.7 (unsuccessful) |
| Imperial Joint Maths & Computing | 2025 entry | Mean | 7.5 | 4.6 (unsuccessful) |
| Imperial Computing | 2025 entry | Mean | 6.2 | 3.7 (unsuccessful) |
| Imperial Business School | 2025 entry | Mean | 5.3 | 3.2 (not interviewed) |
| LSE BSc Mathematics with Economics | 2025 entry | Median | 7.35 | 7.1 |
| LSE BSc Economics | 2025 entry | Median | 7.1 | 6.7 |
| LSE BSc | 2025 entry | Median | 6.6 | 6.7 |
Most universities don’t publish TMUA scores, but Cambridge, Imperial and LSE have released figures, and together they tell you more than any single average would. At Cambridge, offer holders averaged 6.31, a full 1.75 points above the 4.56 average for all its TMUA applicants. That applicant average is close to the 4.5 UAT-UK expects from a typical candidate, so applying to Cambridge doesn’t mean you’re up against a field of top scorers. It’s the offer holders who pull away from the pack. Going by the 2025/26 results, 6.31 falls between 6.0 and 6.5, which is roughly the top 13 to 19% of everyone who sat the test.
Imperial’s figures show how much the course matters. Mathematics and Joint Maths and Computing offer holders averaged 7.6 and 7.5, which would put them in roughly the top 7% of all candidates. Computing offer holders averaged 6.2 and Business School offer holders 5.3, so there’s a gap of more than two points between courses at the same university. The Business School figures are worth a closer look: applicants who were interviewed but didn’t get an offer averaged 5.0, barely below offer holders, while those who weren’t interviewed averaged 3.2. Your score gets you to interview, and the interview decides the rest.
LSE is different again. Its applicants already score highly, with medians of 6.7 to 7.1, so offer holders’ medians are only slightly higher. On Mathematics and Economics, the offer-holder median of 6.6 is actually a touch below the applicants’ 6.7. Once your score is in the right range, LSE is clearly weighing the rest of your application heavily, and it made an Economics offer to one applicant who scored 3.9.
These figures aren’t directly comparable (Cambridge and Imperial give averages, LSE gives medians) and none of them is a cut-off. As a rough guide, though, 6.5 or above makes you competitive for most TMUA courses, and you’ll want to aim for 7.5 or higher for Imperial Mathematics or Joint Maths and Computing.
Conclusion
Hopefully, from the above, you have a better understanding of how the scoring and results of the TMUA works.
What is key to remember is that the conversion table and the distribution of results are not set in stone and will fluctuate each year due to the perceived difficulty of the Admissions Test.
Whatever your TMUA score may be, remember that it is only a fraction of what makes up your university application. With a strong Personal Statement and exam results, even an average TMUA score may not hold back your application. You can find a range of practice past papers for the TMUA if you do want to maximise your chances of scoring well.
Maximise your TMUA score through effective TMUA preparation.
The TMUA is a vital component of your Cambridge application so scoring highly can mean the difference between an offer or rejection. At UniAdmissions, we are experts at boosting your TMUA score and maximising your chances of gaining a place.
Discover our TMUA support by clicking the button below to enrol and triple your chances of success.
FAQ's
A score of 6.5 or above is widely considered competitive. Based on the 2025/26 results, the most common score was 3.5 and the majority of candidates scored between 2.5 and 5.5, meaning anything above 5.5 to 6.0 already puts you ahead of most of the cohort. Only around 15% of test takers reach 6.5 or higher, and approximately 3% achieve the maximum 9.0. If you can land in that top 15%, your TMUA score will be a genuine asset to your application rather than just a neutral data point.
No. Each of the 40 questions across the two papers carries equal marks and there is no penalty for incorrect answers. This means it is always worth attempting every question, even if you are not fully confident in your answer. Leaving a question blank guarantees zero marks for that question, whereas an educated guess gives you a chance of picking up marks.
Results are released roughly four weeks after your test date. For the October sitting, that means scores arrive towards the end of November. For the January sitting, results come in mid-February. You will find your score in your UAT-UK account dashboard on the release day and do not need to take any action, as your results are passed directly to your chosen university or college automatically.
A genuinely outstanding interview or exceptional predicted grades can still carry weight. That said, a stronger TMUA score meaningfully reduces the pressure on the other parts of your application, so thorough preparation is worth the effort.

